Stocks rallied to new highs, but more questions arise

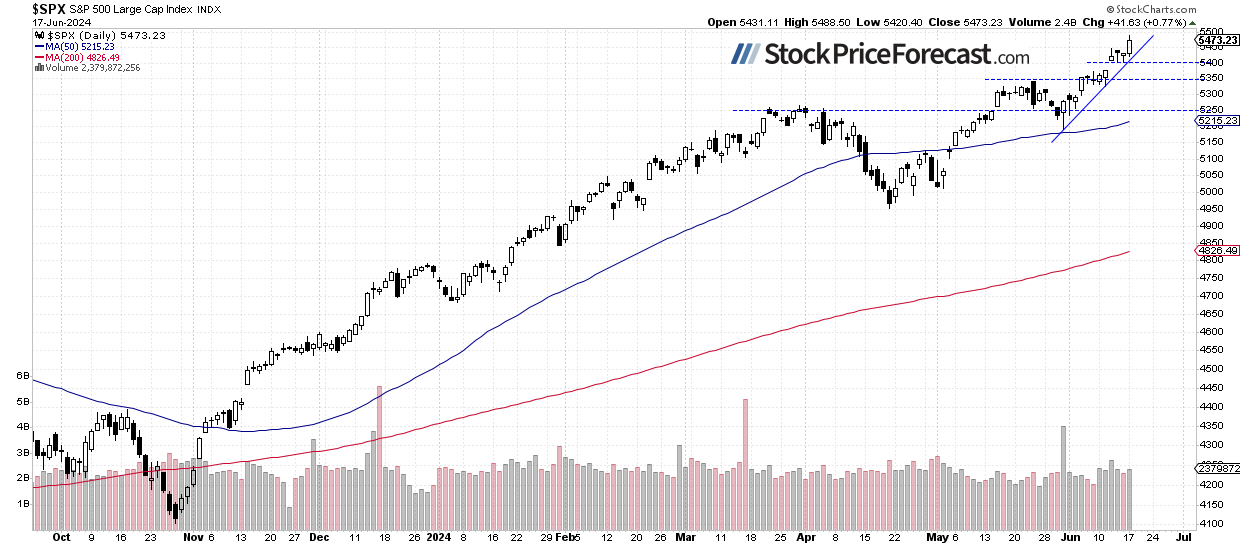
Despite rather neutral expectations before the opening of the S&P 500 index, stock prices broke above their recent trading range yesterday, and the index reached a new record high of 5,488.50. It closed 0.77% higher after a slight retreat at the end of the day. This morning, futures contracts are pointing to another flat opening for the index, following lower-than-expected Retail Sales data.
In my forecast for June, I wrote “For the last three months, the S&P 500 index has been fluctuating along new record highs, above the 5,000 level which was broken in February. It looks like a consolidation within a long-term uptrend, but it may also be a topping pattern before some meaningful medium-term correction. What is it likely to do? As the saying goes, 'the trend is your friend', so the most likely scenario is more advances in the future.
However, a negative signal would be a breakdown below the 5,000 level. That would raise the question of a deeper correction and downward reversal. I think that the likelihood of a bullish scenario is 60/40 - a downward reversal cannot be completely ruled out. The market will be waiting for more signals from the Fed about potential interest rate easing, plus, at the end of the month, the coming earnings season may dictate the market moves.”
Investor sentiment much improved, as indicated by the AAII Investor Sentiment Survey last Wednesday, which showed that 44.6% of individual investors are bullish, while 25.7% of them are bearish (down from last week's reading of 32.0%). The AAII sentiment is a contrary indicator in the sense that highly bullish readings may suggest excessive complacency and a lack of fear in the market. Conversely, bearish readings are favorable for market upturns.
The S&P 500 index continues to trade above a short-term upward trend line, as we can see on the daily chart.
Nasdaq 100 accelerated higher
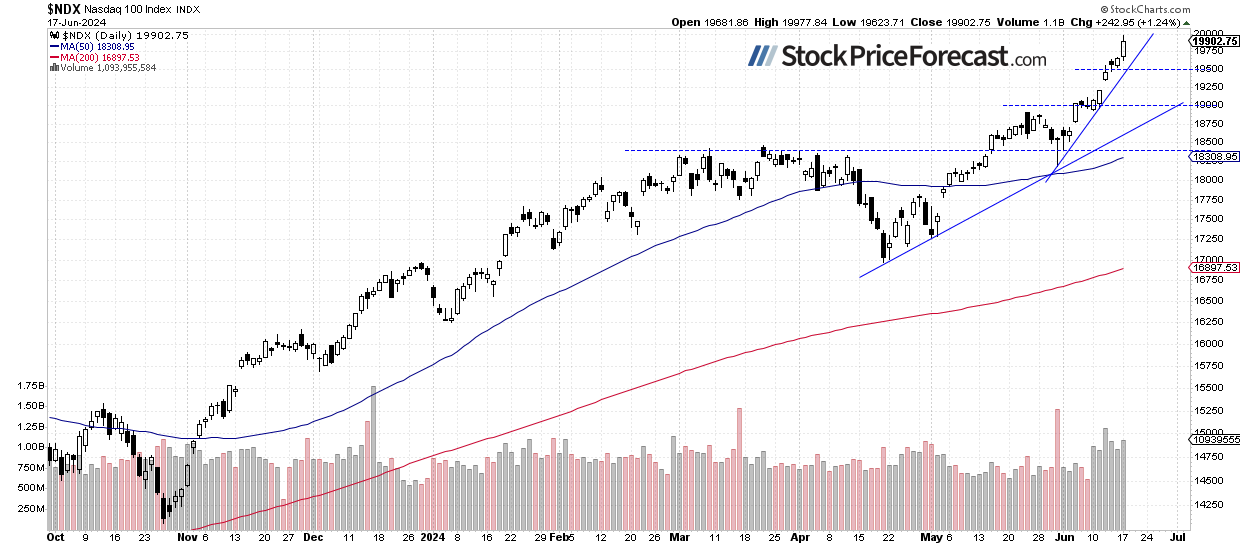
On Monday, the technology-focused Nasdaq 100 index reached a new record high of 19,977.84 and closed 1.24% higher. Once again, it was led by the rallying big-cap stocks, including AAPL, MSFT, and NVDA. This morning, the Nasdaq 100 is likely to open 0.2% higher, suggesting that the index might take a breather after its strong performance yesterday.
VIX going sideways
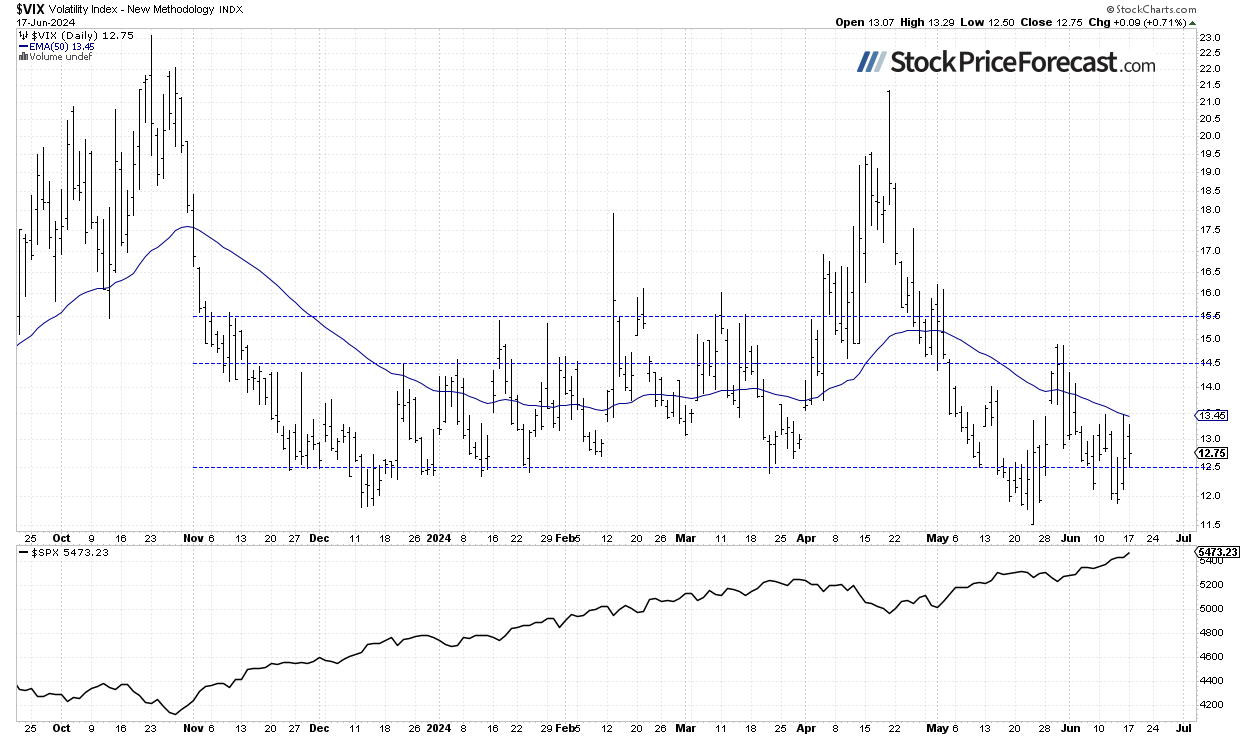
The VIX index, also known as the fear gauge, is derived from option prices. In late May, it set a new medium-term low of 11.52 before rebounding up to around 15 on correction worries. Recently, the VIX came back towards 12. On Friday, it was as high as 13.45, before closing within a short-term range, and yesterday, it remained near the 13 level.
Historically, a dropping VIX indicates less fear in the market, and rising VIX accompanies stock market downturns. However, the lower the VIX, the higher the probability of the market’s downward reversal.
Futures contract trades above 5,500
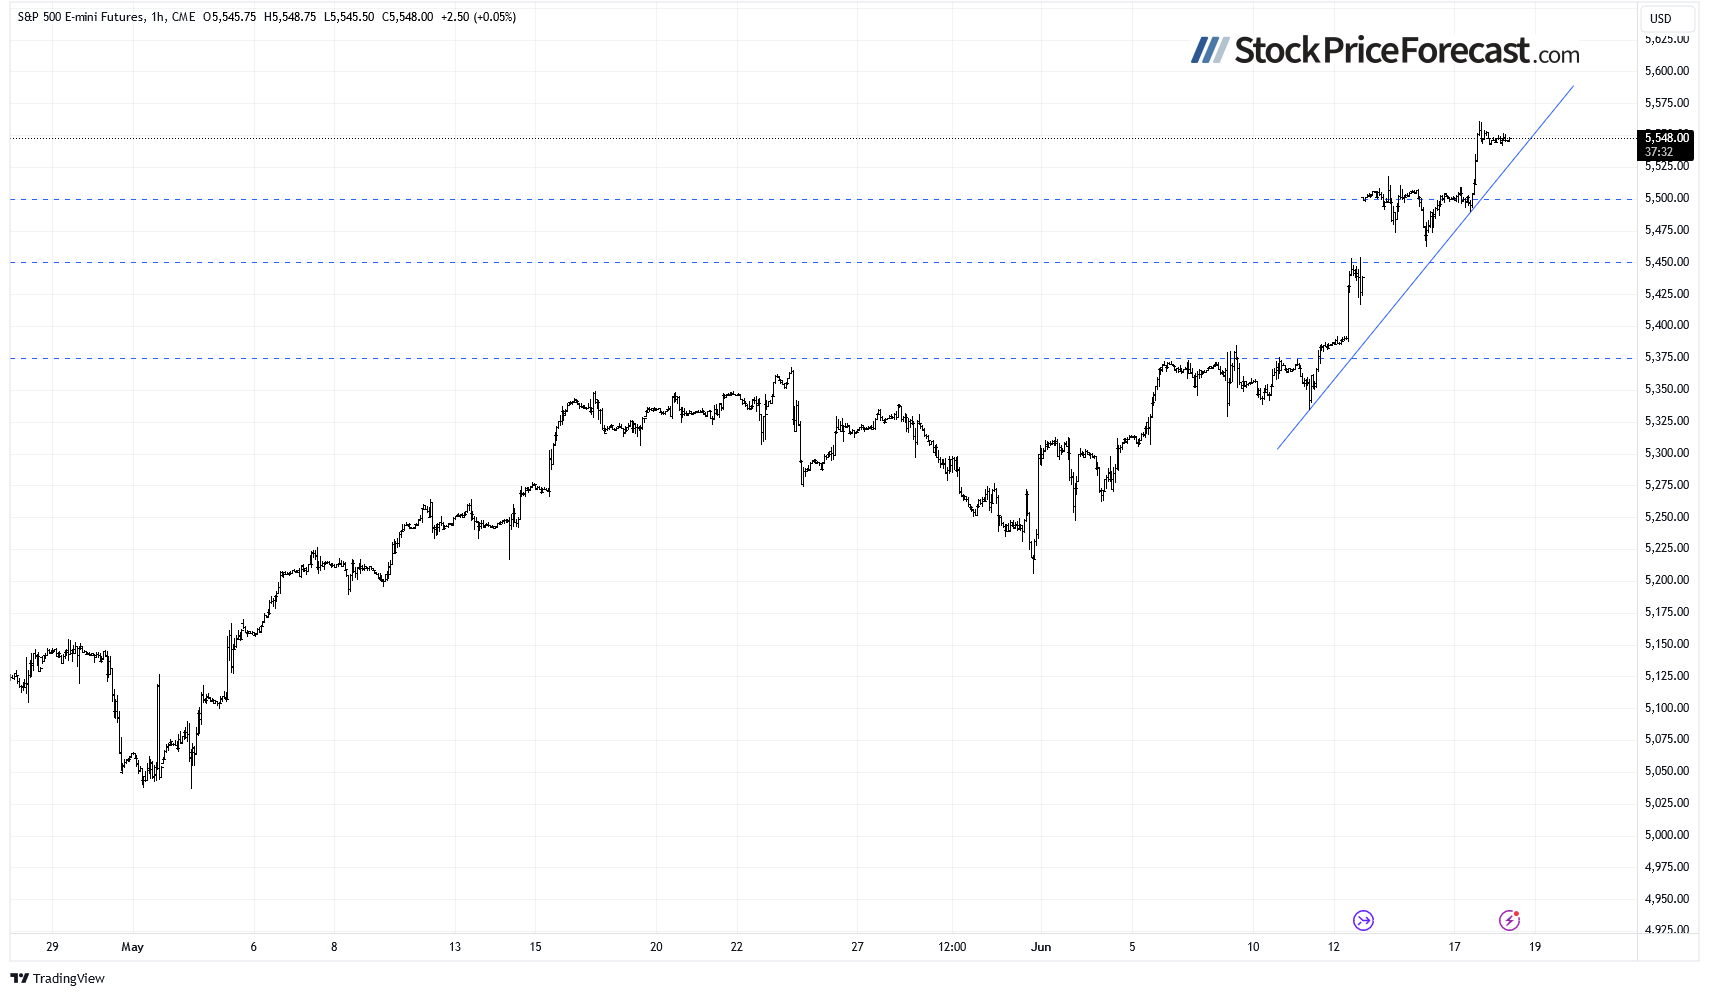
Let’s take a look at the hourly chart of the S&P 500 futures contract. Yesterday, it broke above the recent trading range and a resistance level of around 5,500, and this morning, it is trading within a relatively narrow price range – along a new record high. There have been no confirmed negative signals so far; however, a profit-taking action may occur at some point. The support level is now at 5,500.
Conclusion
Will stocks further extend their uptrend and reach new records despite some short-term overbought conditions? There have been no confirmed negative signals; however, later in the week, the market will get more economic data: the Unemployment Claims on Thursday, and on Friday – the important Flash Manufacturing PMI/ Flash Services PMI data. Tomorrow, there will be a holiday in the U.S., likely leading to calm trading today. On Friday, the ‘quadruple witching day’ may cause volatility.
On previous Friday, I noted “Will the market retrace some of its recent rally? The bearish argument is relatively thin trading, with only a handful of stocks like NVDA, MSFT, or AAPL responsible for the rally. On the other hand, the trend is still upwards, hence further advances are more likely”
For now, my short-term outlook remains neutral.
Here’s the breakdown:
-
The S&P 500 is likely to open virtually flat and fluctuate following yesterday’s rally; it may see a profit-taking at some point.
-
Stock prices reached new record highs despite mixed data and growing uncertainty.
-
In my opinion, the short-term outlook is neutral.
Want free follow-ups to the above article and details not available to 99%+ investors? Sign up to our free newsletter today!
Want free follow-ups to the above article and details not available to 99%+ investors? Sign up to our free newsletter today!
Author

Paul Rejczak
Sunshine Profits
Paul Rejczak is a stock market strategist who has been known for the quality of his technical and fundamental analysis since the late nineties.


