Stocks: More uncertainty ahead of inflation data

Stocks extended their rebound on Friday, with the S&P 500 index reaching a local high of 5,358.67 and closing 0.47% higher. The market has retraced more of its recent declines, but is this the start of a new uptrend or just a correction before another leg lower? Today, the S&P 500 is likely to open 0.2% higher, as investors await key inflation data this week: the Producer Price Index tomorrow and the crucial Consumer Price Index on Wednesday.
The investor sentiment worsened last week, as indicated by Wednesday's AAII Investor Sentiment Survey, which showed that 40.5% of individual investors are bullish, while 37.5% of them are bearish – up from 25.2% last week.
The S&P 500 index rebounded from the 5,100 level last week, as we can see on the daily chart.
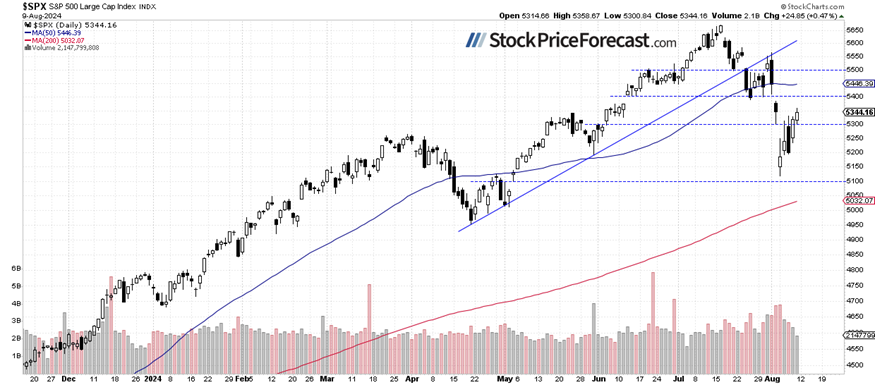
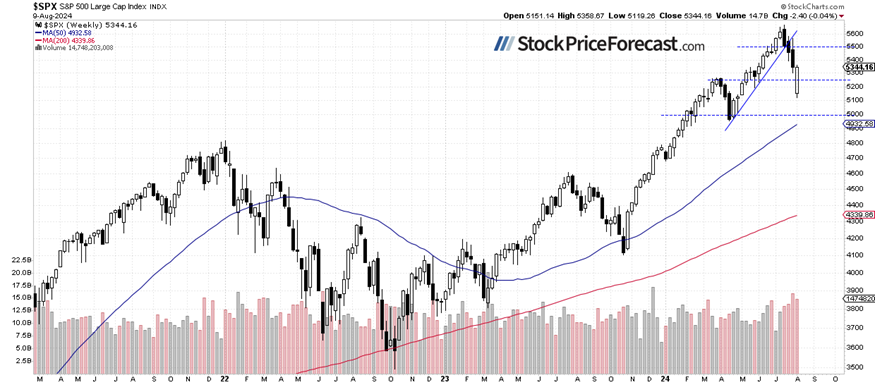
S&P 500 retraced all losses from last week
Compared to the previous Friday’s closing price, the index lost just 0.04%, but last Monday, it was trading over 4% lower. Overall, it was a positive week for stocks, and such a rebound favors the bullish side in the near future.
On July 15, I wrote that “there are signs that the market is getting ready for a correction or a consolidation” and it proved correct. The index broke below its months-long upward trend line.
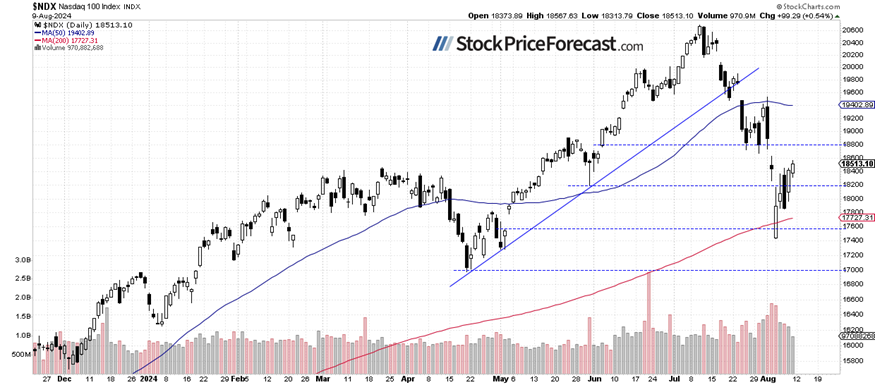
Nasdaq 100: Above 18,500
The technology-focused Nasdaq 100 gained 0.54% on Friday, extending its Thursday rally of over 3%. It recovered from Wednesday’s sell-off and closed the week 0.4% higher. This morning, the Nasdaq 100 is likely to open 0.3% higher, slightly extending its short-term uptrend.
It’s likely that the market will experience more consolidation, although many investors hope for a V-shaped rally from the current levels.
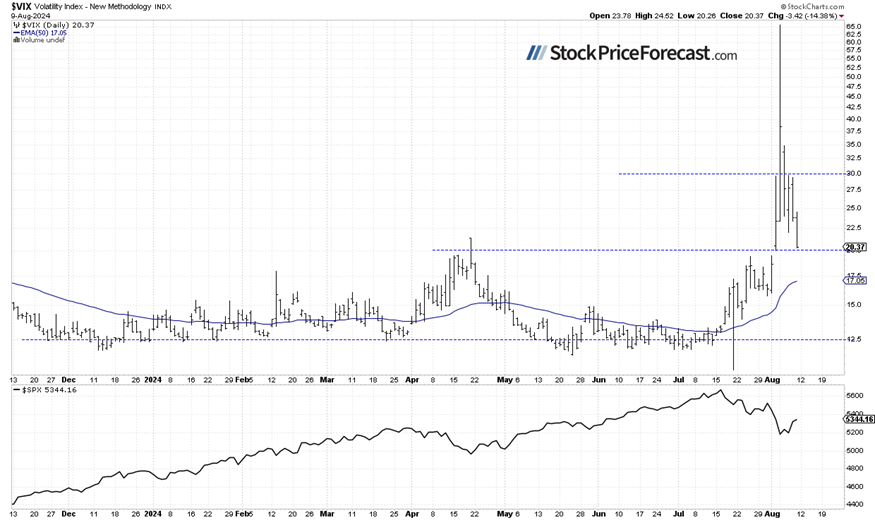
VIX is closer to 20 again
The VIX index, a measure of market fear, accelerated its advance on previous Friday, nearing 30, and last Monday, it reached as high as 65.73—the highest level since the 2008 financial crisis and the COVID sell-off in 2020. This reflected significant fear in the market. However, on Friday, the VIX dipped closer to the 20 level, further reducing market volatility.
Historically, a dropping VIX indicates less fear in the market, and rising VIX accompanies stock market downturns. However, the lower the VIX, the higher the probability of the market’s downward reversal. Conversely, the higher the VIX, the higher the probability of the market’s upward reversal.
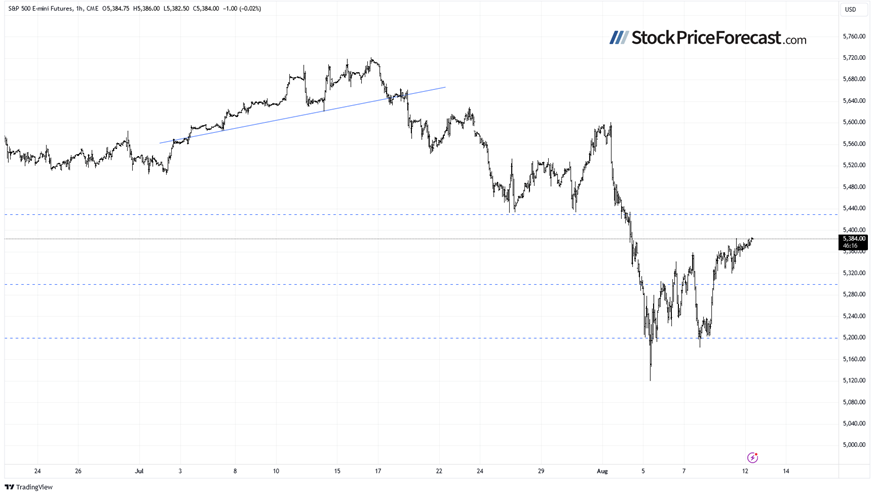
Futures contract creeping higher
Let’s take a look at the hourly chart of the S&P 500 futures contract. Last Monday, it traded as low as 5,120, rebounded to around 5,360 on Wednesday, then pulled back below 5,200 before rebounding to local highs above 5,380. However, Friday’s trading action was much calmer, and volatility decreased. Is this a sign of a failing rebound? The key resistance level remains around 5,430, marked by the previous local lows.
Conclusion
In my Stock Price Forecast for August, I noted “a sharp reversal occurred, and by the end of the month, the S&P 500 experienced significant volatility following the sell-off. August is beginning on a very bearish note, but the market may find a local bottom at some point.”
Stock prices are set to open slightly higher, extending last week’s rebound. However, the market may experience consolidation as investors await key inflation data tomorrow and on Wednesday. Wednesday is likely to bring a return of market volatility.
On Friday, I wrote “(…) rebound brought some hope for bulls, but it seems they are not out of the woods yet. The recent sell-off was significant, and it will likely take more time to recover.
There is also a chance that the current advances are merely an upward correction, and the market could revisit its lows at some point.”
Last week’s trading action was pretty bullish following a lower opening on Monday, and this week, we may see more uncertainty and volatility in both directions.
My short-term outlook is now neutral.
Here’s the breakdown:
-
The S&P 500 index reached its lowest level since early May last Monday; since then, the market has been rebounding.
-
The market found a short-term bottom, but this may only be temporary; no positive signals are evident.
-
In my opinion, the short-term outlook is neutral.
Want free follow-ups to the above article and details not available to 99%+ investors? Sign up to our free newsletter today!
Want free follow-ups to the above article and details not available to 99%+ investors? Sign up to our free newsletter today!
Author

Paul Rejczak
Sunshine Profits
Paul Rejczak is a stock market strategist who has been known for the quality of his technical and fundamental analysis since the late nineties.


