Will the S&P 500 find support after its worst two-day decline since March 2020?

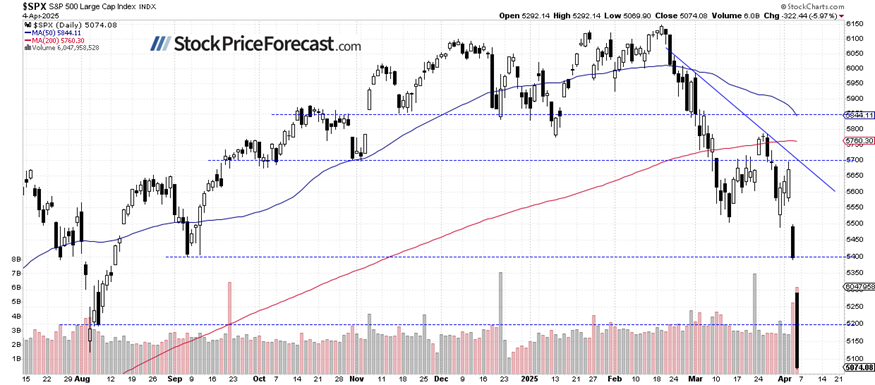
The S&P 500 collapsed 5.97% on Friday, crashing below the 5,100 level as investors reacted violently to Wednesday's Trump tariff announcement. The index is now trading at its lowest levels since April 2024, with futures indicating another 1.8% drop at today's open. However, it has retraced some of its overnight sell-off, indicating a possibility of a rebound or short-term upward reversal.

Investor sentiment has significantly worsened, as shown in the Wednesday’s AAII Investor Sentiment Survey, which reported that 21.8% of individual investors are bullish, while 61.9% of them are bearish.

The S&P 500 accelerated its historic sell-off, as we can see on the daily chart.

Chart

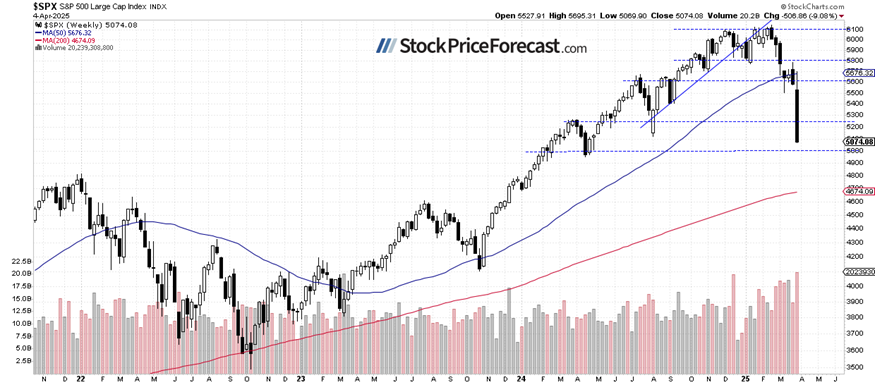
S&P 500: Huge decline last week

The S&P 500 sold off by 9.08% last week, accelerating its downtrend following Trump’s tariff announcement on Wednesday. It experienced its worst weekly performance since March 2020.

Previously established support around 5,500 was violated easily, and the severity of this decline suggests we're no longer in a simple consolidation but potentially entering a more pronounced bear market.

Chart

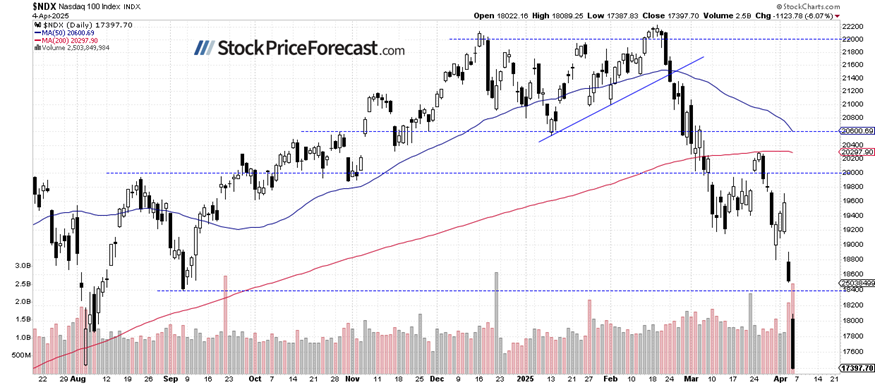
Nasdaq 100: Tech stocks lead market crash

The tech-heavy Nasdaq 100 has been hit particularly hard, closing 6.07% lower on Friday, losing 9.77% in a week. Futures indicate that this index will open 2.1% lower today, extending losses after Friday's session. Technical supports have been obliterated. However, a short-term rebound may be coming at some point.

Chart

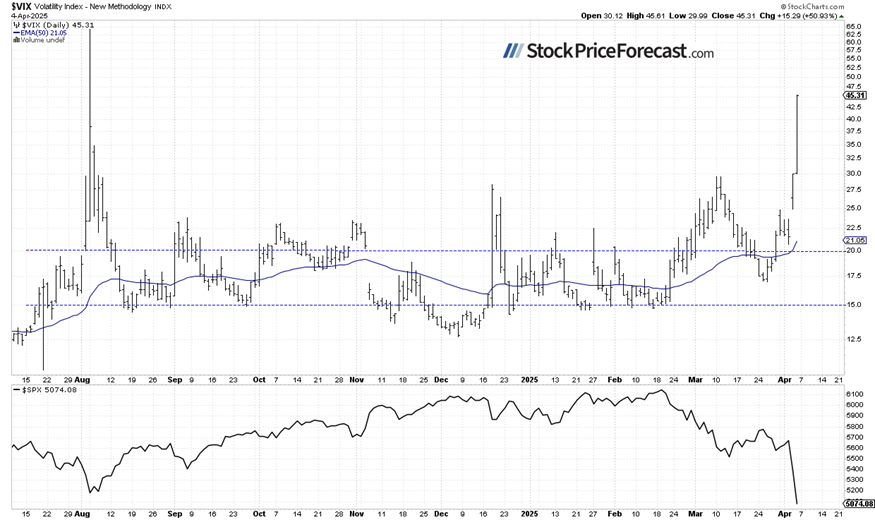
VIX explodes above 60 intraday

The VIX index has surged above 60 intraday, reaching its highest level since August last year and signaling extreme fear in the marketplace. On Friday, it closed above 45.

Historically, a dropping VIX indicates less fear in the market, and rising VIX accompanies stock market downturns. However, the lower the VIX, the higher the probability of the market’s downward reversal. Conversely, the higher the VIX, the higher the probability of the market’s upward reversal.

Chart

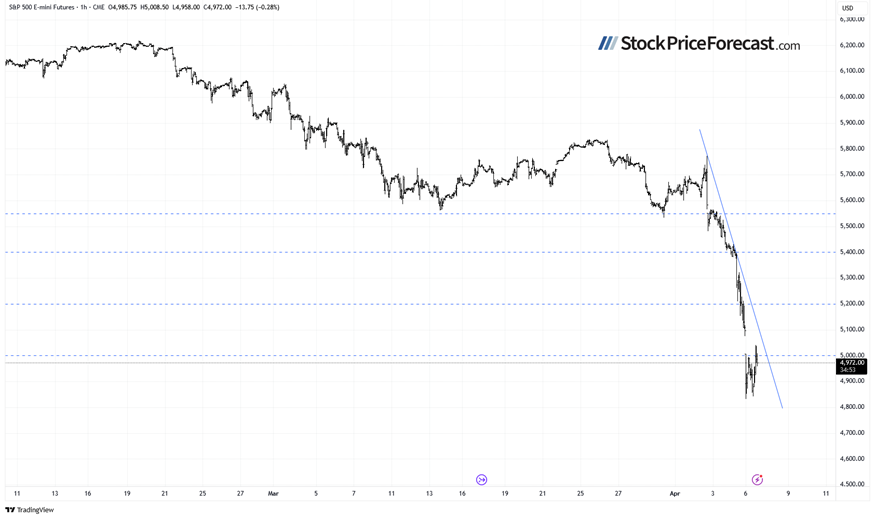
S&P 500 futures signaling further weakness

This morning, the S&P 500 futures contract is trading down approximately 1.8%, suggesting continued selling pressure at the open. Overnight trading has been extremely volatile. Current resistance is around 5,000-5,100, with support at 4,800-4,900.

Chart

Conclusion

The stock market is experiencing its most severe selloff since the COVID-19 pandemic as investors digest the implications of a global trade war. Key support levels have been violated across all major indices, confirming technical damage that will take time to repair.

Today, stock prices are expected to open lower again, however, more volatility is likely, and rebound attempts are likely to take place.

Here’s the breakdown:

  • The S&P 500 continues its sharp sell-off following last week’s Trump's tariff announcement and China's retaliation.

  • While no positive signals are evident yet, stocks may be nearing a potential short-term bottom

  • In my opinion, the short-term outlook is neutral.


Want free follow-ups to the above article and details not available to 99%+ investors? Sign up to our free newsletter today!

Share: Feed news

All essays, research and information found above represent analyses and opinions of Przemyslaw Radomski, CFA and Sunshine Profits' employees and associates only. As such, it may prove wrong and be a subject to change without notice. Opinions and analyses were based on data available to authors of respective essays at the time of writing. Although the information provided above is based on careful research and sources that are believed to be accurate, Przemyslaw Radomski, CFA and his associates do not guarantee the accuracy or thoroughness of the data or information reported. The opinions published above are neither an offer nor a recommendation to purchase or sell any securities. Mr. Radomski is not a Registered Securities Advisor. By reading Przemyslaw Radomski's, CFA reports you fully agree that he will not be held responsible or liable for any decisions you make regarding any information provided in these reports. Investing, trading and speculation in any financial markets may involve high risk of loss. Przemyslaw Radomski, CFA, Sunshine Profits' employees and affiliates as well as members of their families may have a short or long position in any securities, including those mentioned in any of the reports or essays, and may make additional purchases and/or sales of those securities without notice.

XM
Account
7.2
Tools
9.2
Service
9.4
Trading
9.0
Trust
7.0
Experience
8.4
Read review
Moneta Markets
Account
7.4
Tools
6.6
Service
8.0
Trading
6.6
Trust
5.2
Experience
9.2
Read review
Trading Pro
Account
7.2
Tools
5.2
Service
6.6
Trading
8.0
Trust
5.0
Experience
7.0
Read review
Pepperstone
Account
8.2
Tools
8.2
Service
7.4
Trading
9.0
Trust
8.8
Experience
9.0
Read review
XM
Read review
Moneta Markets
Read review
Trading Pro
Read review
Pepperstone
Read review
Trading Pro
Read review
Pepperstone
Read review
XM
Read review
Moneta Markets
Read review
Trading Pro
Account
7.2
Tools
5.2
Service
6.6
Trading
8.0
Trust
5.0
Experience
7.0
Read review
Pepperstone
Account
8.2
Tools
8.2
Service
7.4
Trading
9.0
Trust
8.8
Experience
9.0
Read review
XM
Account
7.2
Tools
9.2
Service
9.4
Trading
9.0
Trust
7.0
Experience
8.4
Read review
Moneta Markets
Account
7.4
Tools
6.6
Service
8.0
Trading
6.6
Trust
5.2
Experience
9.2
Read review

Recommended content


Recommended content

Editors’ Picks

Gold hovers around all-time highs near $3,250

Gold hovers around all-time highs near $3,250


Gold is holding steady near the $3,250 mark, fuelled by robust safe-haven demand, trade war concerns, and a softer-than-expected US inflation gauge. The US Dollar keeps trading with heavy losses around three-year lows.

Gold News
EUR/USD retreats towards 1.1300 as Wall Street shrugs off trade war headlines

EUR/USD retreats towards 1.1300 as Wall Street shrugs off trade war headlines

The EUR/USD pair retreated further from its recent multi-month peak at 1.1473 and trades around the 1.1300 mark. Wall Street manages to advance ahead of the weekly close, despite escalating tensions between Washington and Beijing and mounting fears of a US recession. Profit-taking ahead of the close also weighs on the pair. 

EUR/USD News
GBP/USD trims gains, recedes to the 1.3050 zone

GBP/USD trims gains, recedes to the 1.3050 zone

GBP/USD now gives away part of the earlier advance to fresh highs near 1.3150. Meanwhile, the US Dollar remains offered amid escalating China-US trade tensions, recession fears in the US, and softer-than-expected US Producer Price data.

GBP/USD News
Bitcoin, Ethereum, Dogecoin and Cardano stabilze –  Why crypto is in limbo

Bitcoin, Ethereum, Dogecoin and Cardano stabilze –  Why crypto is in limbo

Bitcoin, Ethereum, Dogecoin and Cardano stabilize on Friday as crypto market capitalization steadies around $2.69 trillion. Crypto traders are recovering from the swing in token prices and the Monday bloodbath. 

Read more
Is a recession looming?

Is a recession looming?

Wall Street skyrockets after Trump announces tariff delay. But gains remain limited as Trade War with China continues. Recession odds have eased, but investors remain fearful. The worst may not be over, deeper market wounds still possible.

Read more
The Best brokers to trade EUR/USD

The Best brokers to trade EUR/USD

SPONSORED Discover the top brokers for trading EUR/USD in 2025. Our list features brokers with competitive spreads, fast execution, and powerful platforms. Whether you're a beginner or an expert, find the right partner to navigate the dynamic Forex market.

Read More

Forex MAJORS

Cryptocurrencies

Signatures

Best Brokers of 2025