Stocks: Is the rotation preceding a downtrend?

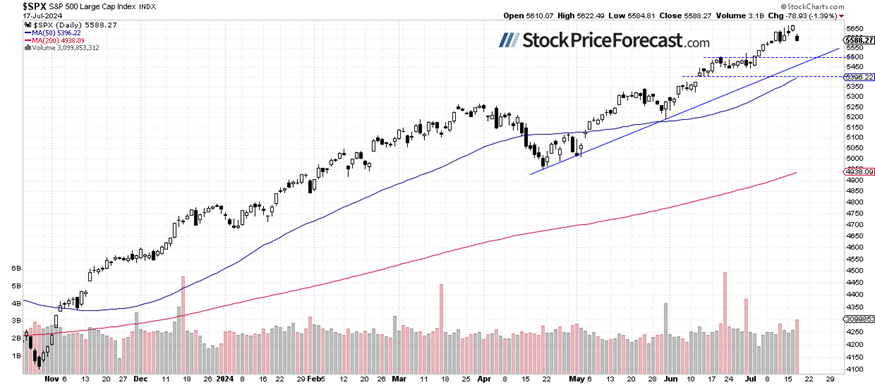
Wednesday’s trading session was bearish, with the S&P 500 index closing 1.39% lower after breaking below the 5,600 level. It was led by declines in the tech sector; however, there was a rotation into ‘old economy’ stocks as the Dow Jones Industrial Average gained 0.60%.
This morning, the S&P 500 is likely to open 0.1% higher, as indicated by futures contract. So, there’s an uncertainty following yesterday’s rout. Will the short-term downtrend continue? It seems more likely, but the market will await quarterly earnings releases from the biggest market caps next week.
Last Tuesday (July 9) I decided to open a speculative short position. In my opinion, the position is still justified.
Investor sentiment has increased significantly, as indicated by the AAII Investor Sentiment Survey yesterday, which showed that 52.7% of individual investors are bullish, while 23.4% of them are bearish.
As I mentioned in my stock price forecast for July, “While more advances remain likely, the likelihood of a deeper downward correction also rises. Overall, there have been no confirmed negative signals so far, but the May gain of 4.8% and June gain of 3.5% suggest a more cautionary approach for July (…) The market will be waiting for the quarterly earnings season in the second half of the month. Plus, there will be a series of economic data, including the CPI release on July 11, the Advance GDP number on July 25, and the FOMC Rate Decision on July 31.”
The S&P 500 index retraced most of its recent advances yesterday, as we can see on the daily chart.
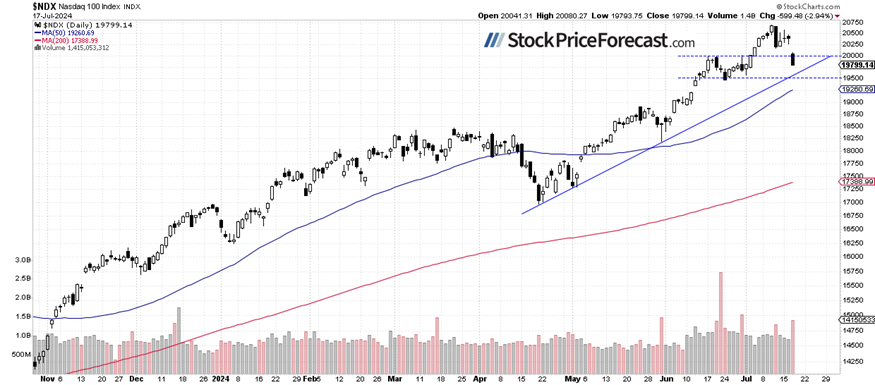
Nasdaq 100: Almost 3% lower
The technology-focused Nasdaq 100 index sold off by 2.94% on Wednesday, led by big declines in META, NVDA stocks, among others. It came back below the 20,000 level.
Last Thursday, I concluded that “There are short-term overbought conditions, and the market is likely to top at some point.” This proved accurate with the recent sharp downward reversal and a sell-off yesterday. This morning, it is expected to open 0.4% higher. For now, it looks like a ‘dead cat bounce’.
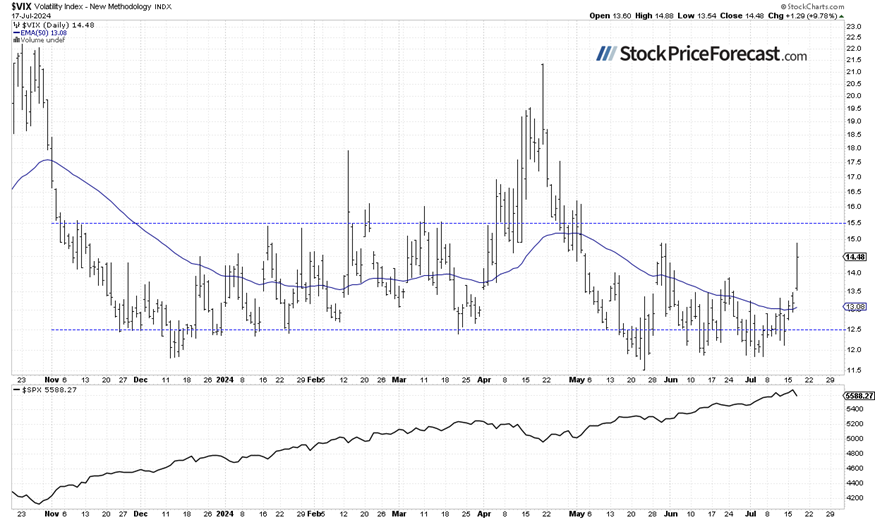
VIX rebounding: More fear
The VIX index, also known as the fear gauge, is derived from option prices. Recently, it has been hovering around the 12 level, which historically is relatively low, indicating low fear in the market. Early this week, the VIX was slightly above the 13 level, and yesterday, it accelerated upwards, reaching almost 15 - the highest since late May.
Historically, a dropping VIX indicates less fear in the market, and rising VIX accompanies stock market downturns. However, the lower the VIX, the higher the probability of the market’s downward reversal.
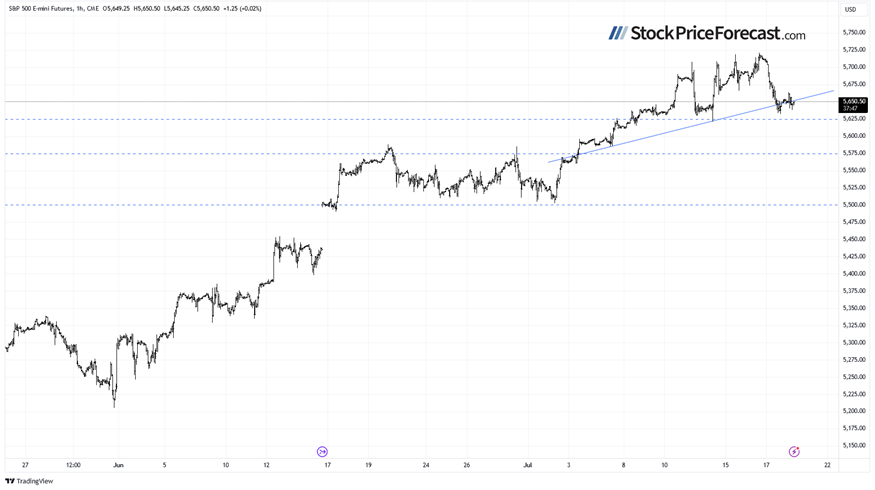
Futures contract: Lower but still within a consolidation
Let’s take a look at the hourly chart of the S&P 500 futures contract. Recently, it was fluctuating along new record highs above the 5,700 level, but yesterday, it sold off towards last Friday’s local low of around 5,621. This morning, the market is basically going sideways. For now, it looks like a flat correction following yesterday’s sell-off. However, the support level remains at 5,600-5,620. It still looks like a short-term consolidation, and possibly, a topping pattern.
Conclusion
Stocks sold off on Wednesday, but it looked like a rotation from the technology sector into a so-called ‘old economy’ sector. The S&P 500 index came back closer to its recent lows, which raises a question: is this a topping pattern or still just a relatively flat correction? It may be a topping pattern, but the market is awaiting quarterly earnings releases (today, after the session close, we will get a report from NFLX); hence, more volatility seems likely in the near future. Earnings releases are generally better than expected; however, they are also met with ‘sell-the-news’ price action.
I opened a speculative short position in the S&P 500 futures contract last Tuesday (July 9).
Quoting my stock price forecast for July, “Investors continue pricing in the Fed’s monetary policy easing that is supposed to happen this year. Hence, a medium-term downward reversal still seems a less likely scenario. However, the recent record-breaking rally may be a cause for some short-term concern as a downward correction may be coming.”
For now, my short-term outlook remains bearish.
Here’s the breakdown:
-
The S&P 500 index may be marking a topping pattern before some more pronounced downward correction.
-
Investors are waiting for the coming quarterly earnings season.
-
In my opinion, the short-term outlook is bearish.
Want free follow-ups to the above article and details not available to 99%+ investors? Sign up to our free newsletter today!
Want free follow-ups to the above article and details not available to 99%+ investors? Sign up to our free newsletter today!
Author

Paul Rejczak
Sunshine Profits
Paul Rejczak is a stock market strategist who has been known for the quality of his technical and fundamental analysis since the late nineties.


