Stocks face uncertainty following Tuesday's sell-off

My speculative short position in the S&P 500 futures contract from August 20, opened at the 5,626 level, is in profit.
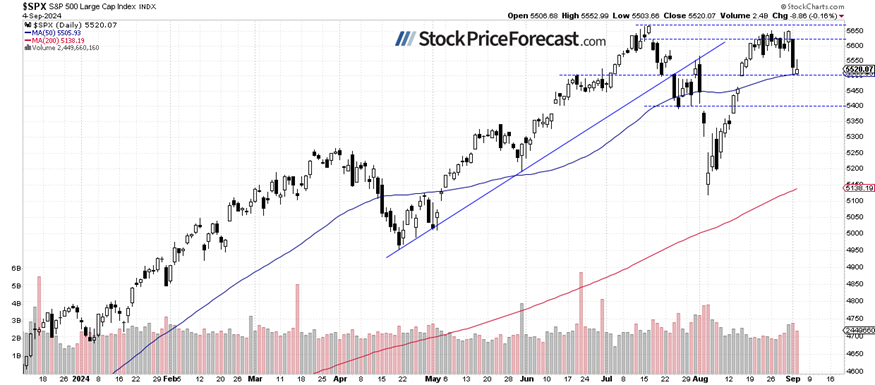
Wednesday’s trading session saw a slight rebound of the S&P 500 index, but it closed 0.16% lower, hovering near its short-term low following Tuesday’s decline of over 2%. The index broke below its recent trading range on Tuesday, which could signal the start of a new short-term downtrend, though it currently looks like a downward correction.
This morning, futures contracts indicate the index will open 0.2% lower, reacting to economic data: a lower-than-expected ADP Non-Farm Employment Change and a slightly weaker Unemployment Claims report.
On August 21, I wrote “Recently, the market has continued to climb following the brief Yen crisis at the start of August, surprising many traders. The question is whether the market will continue to new highs or reverse course and retrace the recent rally. I think there is a chance the market will reverse its course and correct some of the advances, retracing a large part of the rally.”
Despite Thursday's decline, investor sentiment remains elevated, as shown by the AAII Investor Sentiment Survey, which reported that 45.3% of individual investors are bullish, while 24.9% of them are bearish, down from 27.0% last week.
The S&P 500 index continues to trade near the 5,500 level, as we can see on the daily chart.
Nasdaq 100: Hovering around 19,000
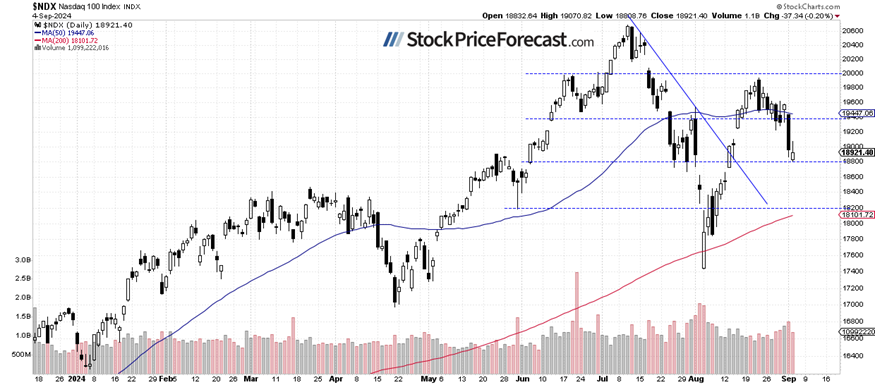
The technology-focused Nasdaq 100 lost 0.20% on Wednesday, fluctuating after Tuesday’s 3.2% sell-off. The sell-off was mainly led by a significant decline in NVDA stock, driven by news about an antitrust investigation and continued profit-taking after last Wednesday’s earnings release. NVDA stock lost an additional 1.7% yesterday.
The resistance level for the Nasdaq 100 remains at 19,200, marked by some previous lows. Today, the Nasdaq 100 is likely to open 0.3% lower.
VIX extended advances
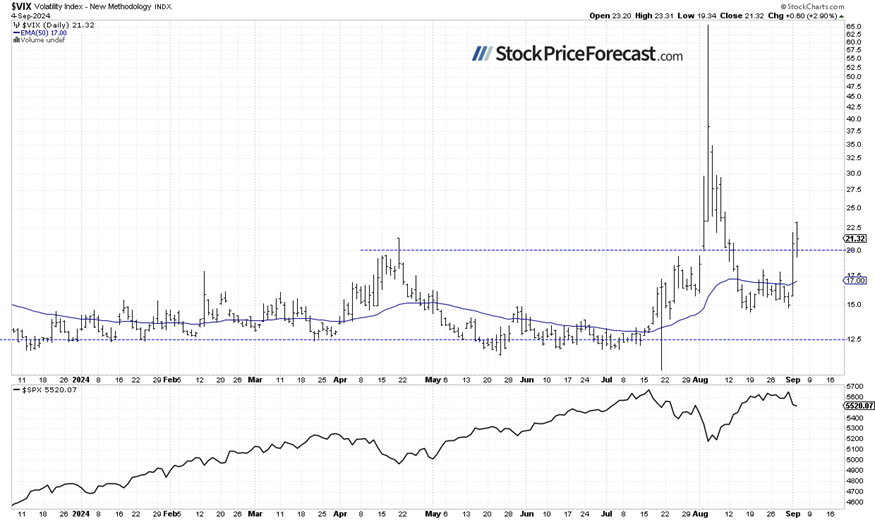
On Tuesday, the VIX index, a measure of market fear, broke above 20. Yesterday, it reached a local high of 23.31, signaling increasing fear amongst investors.
Historically, a dropping VIX indicates less fear in the market, and rising VIX accompanies stock market downturns. However, the lower the VIX, the higher the probability of the market’s downward reversal. Conversely, the higher the VIX, the higher the probability of the market’s upward reversal.
Futures contract: Consolidation after declines
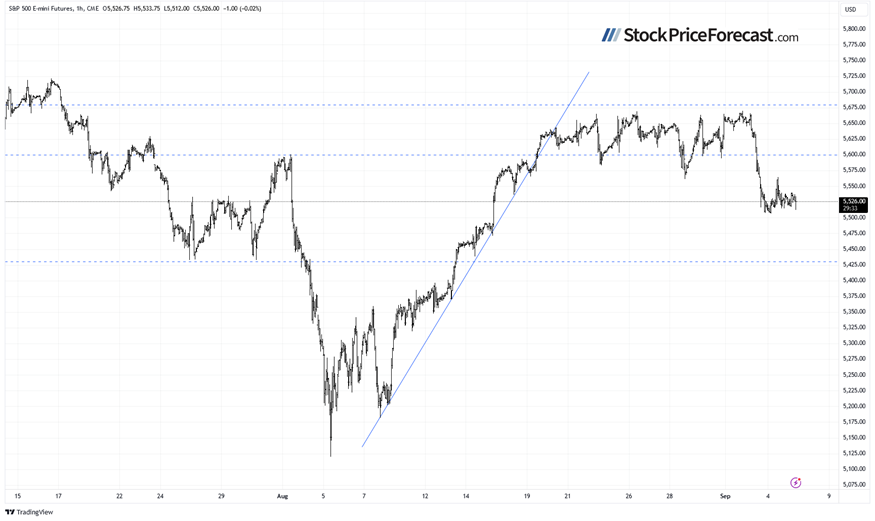
Let’s take a look at the hourly chart of the S&P 500 futures contract. Last week, it saw a consolidation above the 5,600 level. On Wednesday, I mentioned “It still appears to be in a short-term consolidation, likely forming a topping pattern.” This proved accurate as the market broke lower, effectively ending a consolidation.
This morning, the S&P 500 contract is still trading sideways, which looks like a flat correction of the decline. The resistance level remains at 5,560, marked by the previous local low, and the support level is at 5,480-5,500.
Conclusion
On Wednesday, the stock market didn’t do much, as investors hesitated following Tuesday’s sell-off. This could be interpreted as a short-term positive signal, but technically, the market picture remains bearish, with the consolidation appearing to be a flat correction within a downtrend.
This morning, a series of economic data was released, and futures contracts indicate a 0.2% lower opening for the index, following a rebound after the Unemployment Claims report. The S&P 500 is expected to continue consolidating around the 5,500 level.
I am maintaining a speculative short position in the S&P 500 futures contract from August 20.
Yesterday, in my Stock Price Forecast for September 2024, I noted that, “the market experienced significant volatility in August, with a roller-coaster ride that included a sell-off to the August 5 local low and a subsequent advance, leading to a consolidation near the record high. (…) sharp reversal suggests more volatility in September. Last month, I wrote that ‘August is beginning on a very bearish note, but the market may find a local bottom at some point.’ The same could be said today, and September will likely not be entirely bearish for stocks.”
For now, my short-term outlook remains bearish.
Here’s the breakdown:
-
The S&P 500 index is fluctuating after Tuesday’s sell-off; it looks like a flat correction of the downtrend.
-
The market is still likely to extend its short-term declines.
-
In my opinion, the short-term outlook is bearish.
Want free follow-ups to the above article and details not available to 99%+ investors? Sign up to our free newsletter today!
Want free follow-ups to the above article and details not available to 99%+ investors? Sign up to our free newsletter today!
Author

Paul Rejczak
Sunshine Profits
Paul Rejczak is a stock market strategist who has been known for the quality of his technical and fundamental analysis since the late nineties.