Stocks continue to rise amid strong data
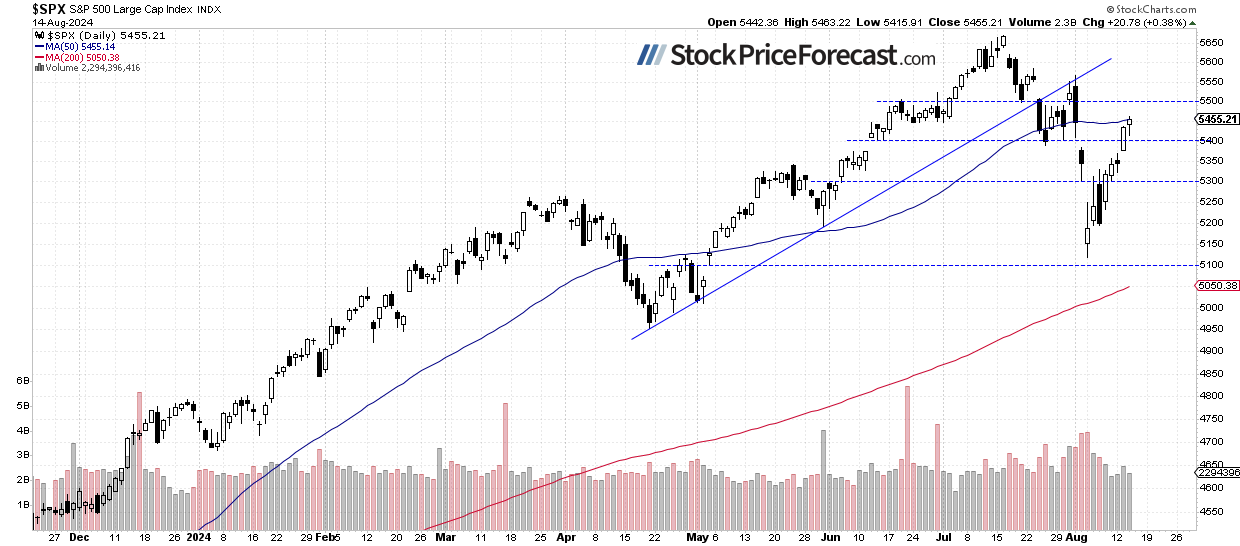
The CPI release led to another stock market advance yesterday, with the S&P 500 index reaching a new local high of 5,463.22 and closing 0.38% higher. This slightly extended the "V" rebound following last Monday's dip to a local low of 5,119.26. The question remains: is this still just an upward correction, or is it an uptrend leading to new all-time highs? This morning, the S&P 500 is likely to open 0.7% higher after a better-than-expected Retail Sales report and WMT earnings. It still appears to be a correction following a decline that started in mid-July; however, the market may also advance towards a double-top or new highs.
Investor sentiment improved, as indicated by yesterday's AAII Investor Sentiment Survey, which showed that 42.5% of individual investors are bullish, while 28.9% of them are bearish – down from 37.5% last week.
The S&P 500 index extended its gains after breaking the 5,400 level, as we can see on the daily chart.
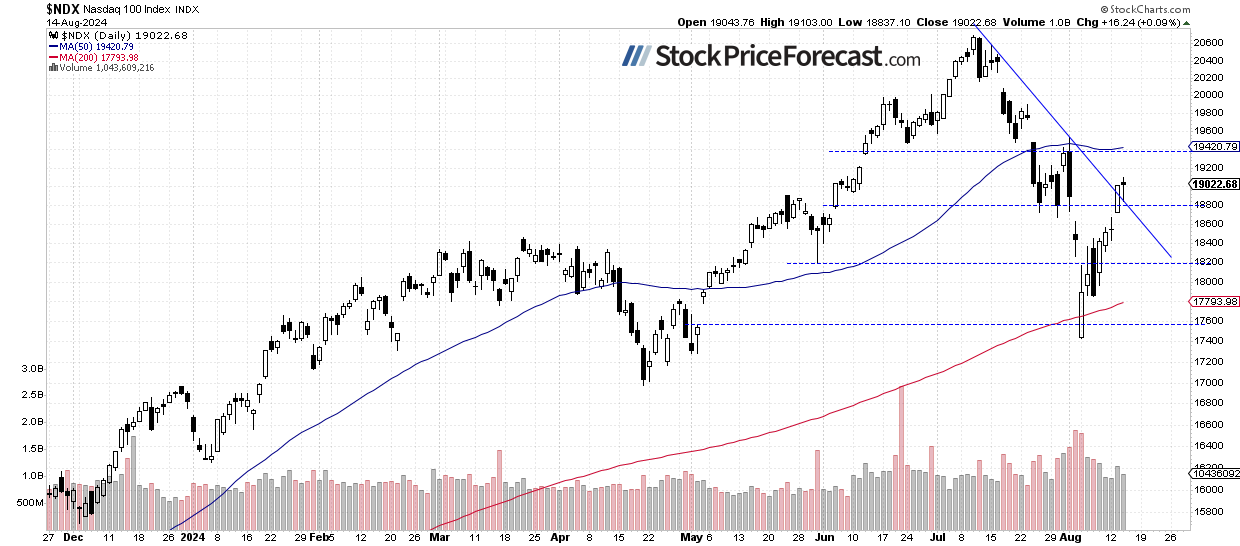
Nasdaq 100 remains above 19,000
The technology-focused Nasdaq 100 accelerated its short-term uptrend on Tuesday, and yesterday, it gained just 0.09%, lagging behind the broader stock market amid mixed FANG stocks performance. This morning, the Nasdaq 100 is likely to open 0.9% higher, and it may get near the early August high.
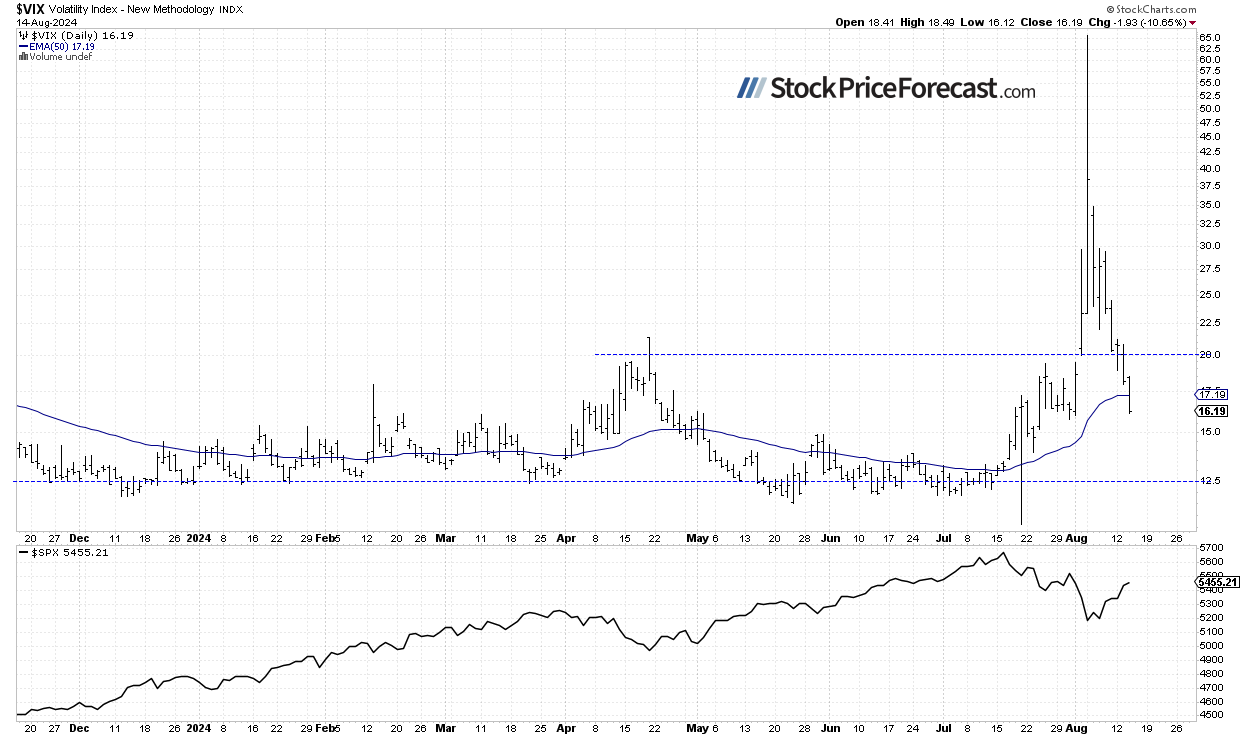
VIX: Even lower
Last Monday, the VIX index, a measure of market fear, reached a new long-term high of 65.73 - the highest level since the 2008 financial crisis and the COVID sell-off in 2020. This reflected significant fear in the market. However, since then, it has been retracing, and yesterday, it dropped as low as 16.12, indicating much less fear.
Historically, a dropping VIX indicates less fear in the market, and rising VIX accompanies stock market downturns. However, the lower the VIX, the higher the probability of the market’s downward reversal. Conversely, the higher the VIX, the higher the probability of the market’s upward reversal.
Futures contract: Getting closer to 5,500
Let’s take a look at the hourly chart of the S&P 500 futures contract. Last Monday, it traded as low as 5,120, rebounded to around 5,360 on Wednesday, then pulled back below 5,200 before breaking back above 5,400. Yesterday, the market neared the 5,500 level, and this morning, it is breaking higher. The support level is at around 5,450.
Conclusion
In my Stock Price Forecast for August, I noted “a sharp reversal occurred, and by the end of the month, the S&P 500 experienced significant volatility following the sell-off. August is beginning on a very bearish note, but the market may find a local bottom at some point.”
The rebound from last Monday’s low has been significant, and bulls have regained control of the market. Will this lead to new record highs? For now, it still seems like a correction within the downtrend.
Are stock prices reaching a local high of the rebound? It may seem so; however, bulls are still in control, at least in the short term. The economic data keep fueling optimism.
Last Friday, I wrote “(…) rebound brought some hope for bulls, but it seems they are not out of the woods yet. The recent sell-off was significant, and it will likely take more time to recover.
There is also a chance that the current advances are merely an upward correction, and the market could revisit its lows at some point.”
My short-term outlook remains neutral.
Here’s the breakdown:
-
The S&P 500 index extended its short-term uptrend again yesterday.
-
Today, the market is likely to go sideways despite good data and earnings.
-
In my opinion, the short-term outlook is neutral.
Want free follow-ups to the above article and details not available to 99%+ investors? Sign up to our free newsletter today!
Want free follow-ups to the above article and details not available to 99%+ investors? Sign up to our free newsletter today!
Author

Paul Rejczak
Sunshine Profits
Paul Rejczak is a stock market strategist who has been known for the quality of his technical and fundamental analysis since the late nineties.


