Stock market head and shoulders patterns forming?
06 September
-
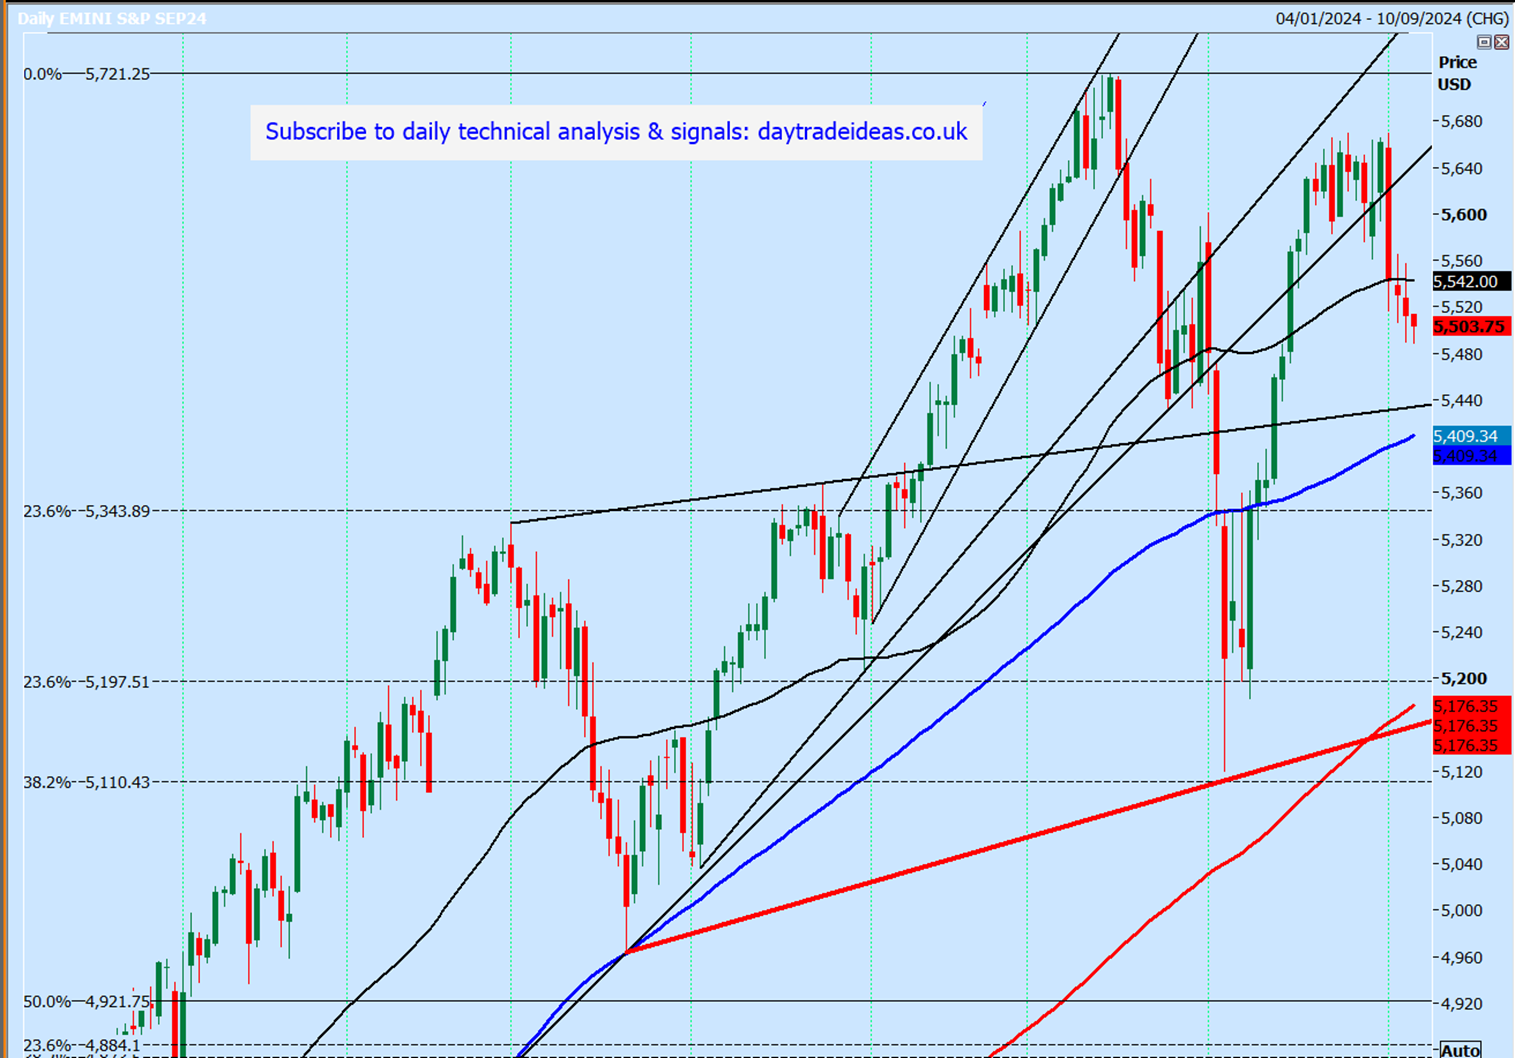
Emini S&P September futures stable again yesterday ahead of today's important data. The low & high for the last session were 5490 - 5557. (To compare the spread to the contract you trade)
-
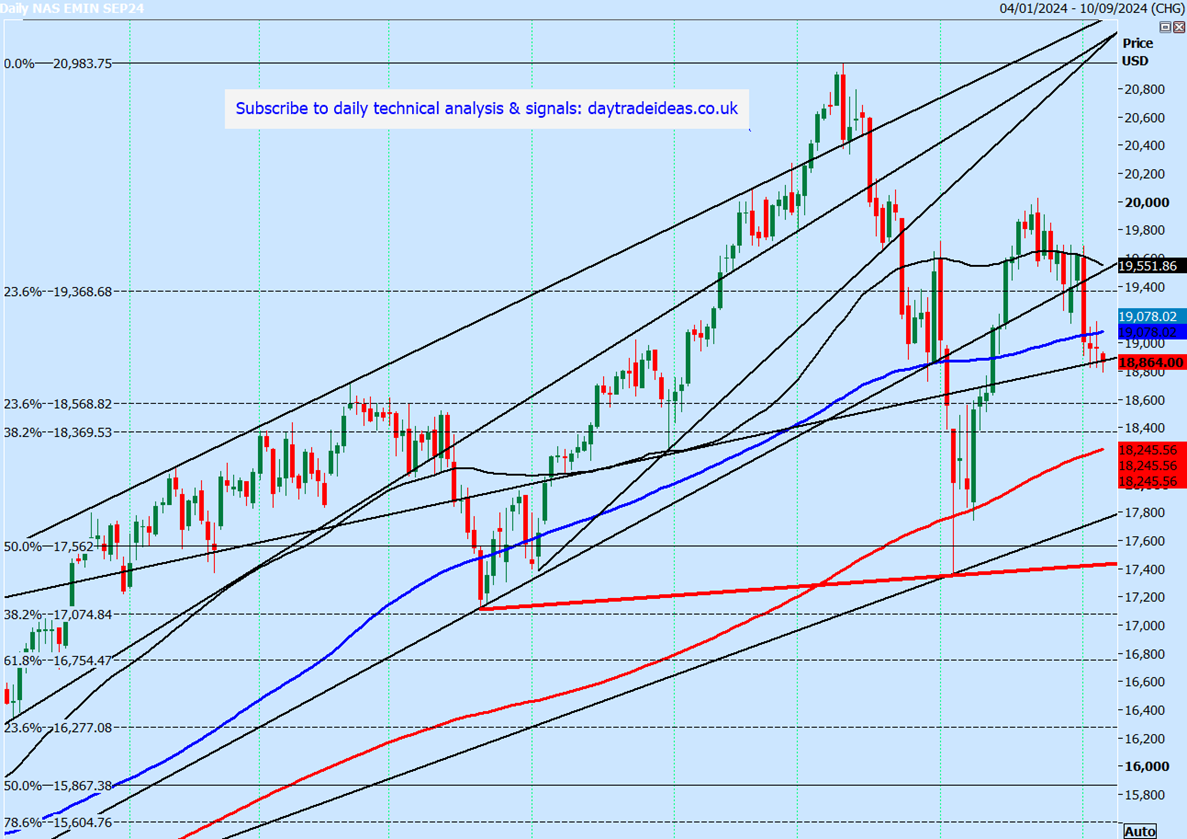
Emini Nasdaq September made a low for the day exactly at 18880/18830 as predicted for the second day & a high for the day at resistance at 19150. Last session high & low for the SEPTEMBER futures contract: 18827 - 19150.
-
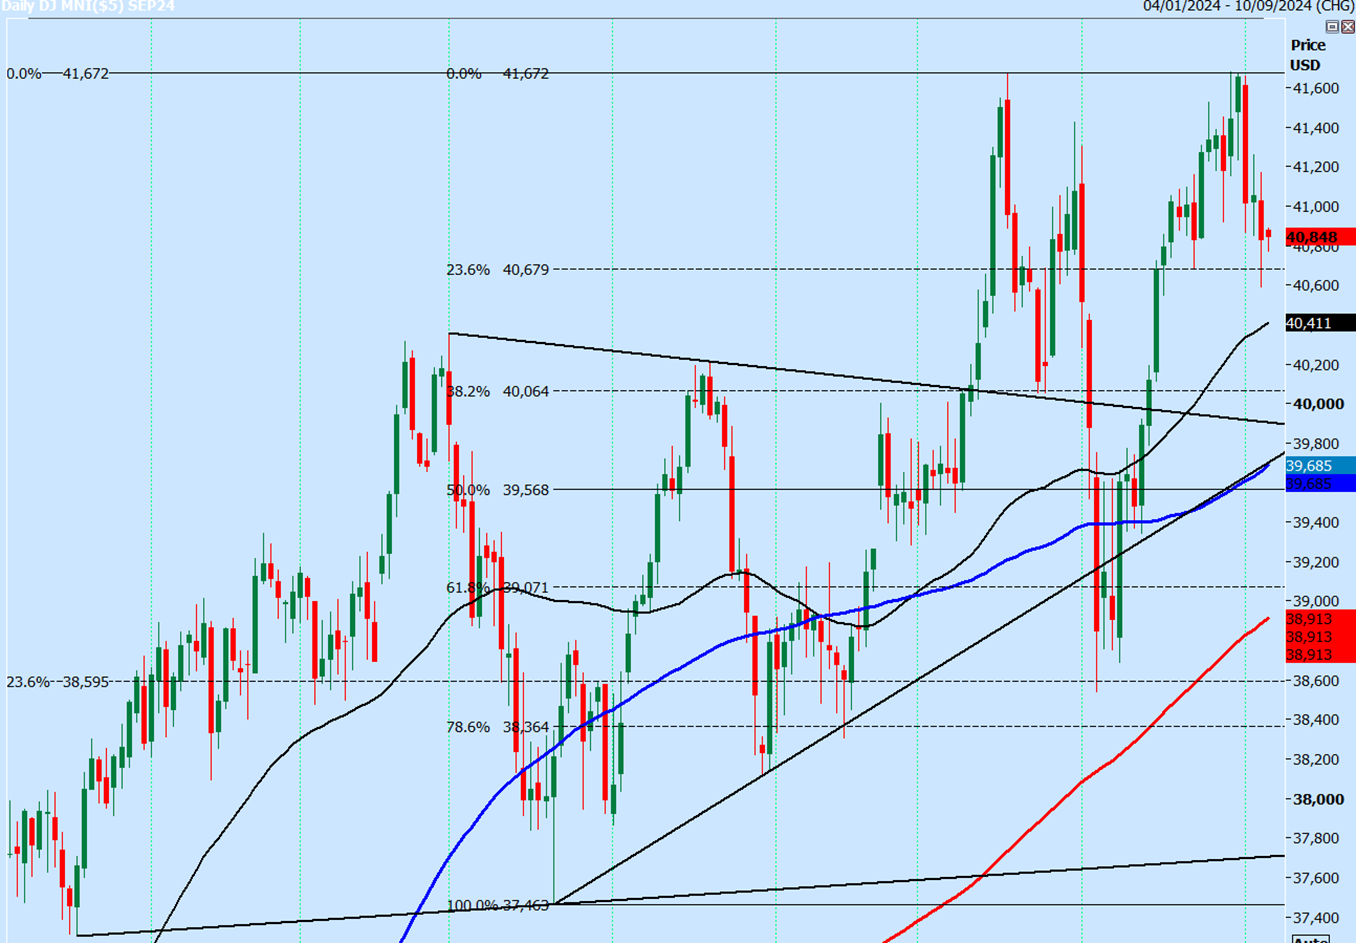
Emini Dow Jones September has a potential double top sell signal after the collapse from the new all time high at 41682. Last session high & low for the SEPTEMBER futures contract: 40593 - 41169.
Emini SP 500 September futures
-
Emini S&P has now started to move with a break below the lower end of the 10 day range at 5575/5560 on Tuesday, hitting 1st target of 5540/30 & 5500/5490, with a low for the day exactly here yesterday.
-
Best support at 5470/60 today & longs need stops below 5450.
-
I could argue that we could be forming a (very lobsided) 6 month head & shoulders pattern with neckline at 5180/50.
-
We should meet resistance at 5565/75 & shorts need stops above 5585. A break above 5585 puts us back in the range of the 2nd half of August.
-
I think we can expect further losses in the days & weeks ahead, to form that right shoulder
Nasdaq September futures
-
I have been warning & watching for the formation of a right shoulder in a 6 month head & shoulders pattern
-
We wrote: ''The index is oversold in the short term & we are testing a 2 year ascending trend line so there is a good chance of a bounce from 18880/18830....We should have resistance at 19100/19150.'' These levels caught the exact low & high for the day, so I hope you managed to scalp both the long & short opportunity.
-
We are retesting 18880/18830 as I write. Longs need a 100 ticks stop loss below the short term Fibonacci levels around 18700.
-
A break below 18700 should be another sell signal targeting strong Fibonacci support at 18600/500, with a good chance of a low for the day here.
-
We should have resistance again at 19100/19150 but shorts need stops above 19250.
- A break higher can target 19370/400 & 19500/550.
Emini Dow Jones September futures
-
Look for short term support at 40700/650 again today, which just about held yesterday. Longs need stops below 40550. A break lower see 40650/700 act as resistance targeting further losses towards 40400/350 & perhaps as far as 40100.
-
I think gains are likely to be limited as downside risks suddenly open & we should have resistance again at 41150/200 (a high for the day exactly here yesterday in fact) then at 41350/390.
Author

Jason Sen
DayTradeIdeas.co.uk


