Starbucks (SBUX) is entering in a expanded flat structure

Starbucks Corporation (SBUX) is an American multinational chain of coffeehouses and roastery reserves. It is the world’s largest coffeehouse chain. As of November 2021, the company had 33,833 stores in 80 countries, 15,444 of which were located in the United States. Out of Starbucks’ U.S.-based stores, over 8,900 are company-operated, while the remainder are licensed.
SBUX completed a cycle from March 2020 low in July 2021 peak and we labeled as wave I. Then we could see a double correction ((W)), ((X)) and ((Y)). A clear 7 swing correction to complete wave II in May 2022. From here, we were calling a beginning of a new rally in the stock.
Starbucks (SBUX) Elliott Wave analysis – December daily chart
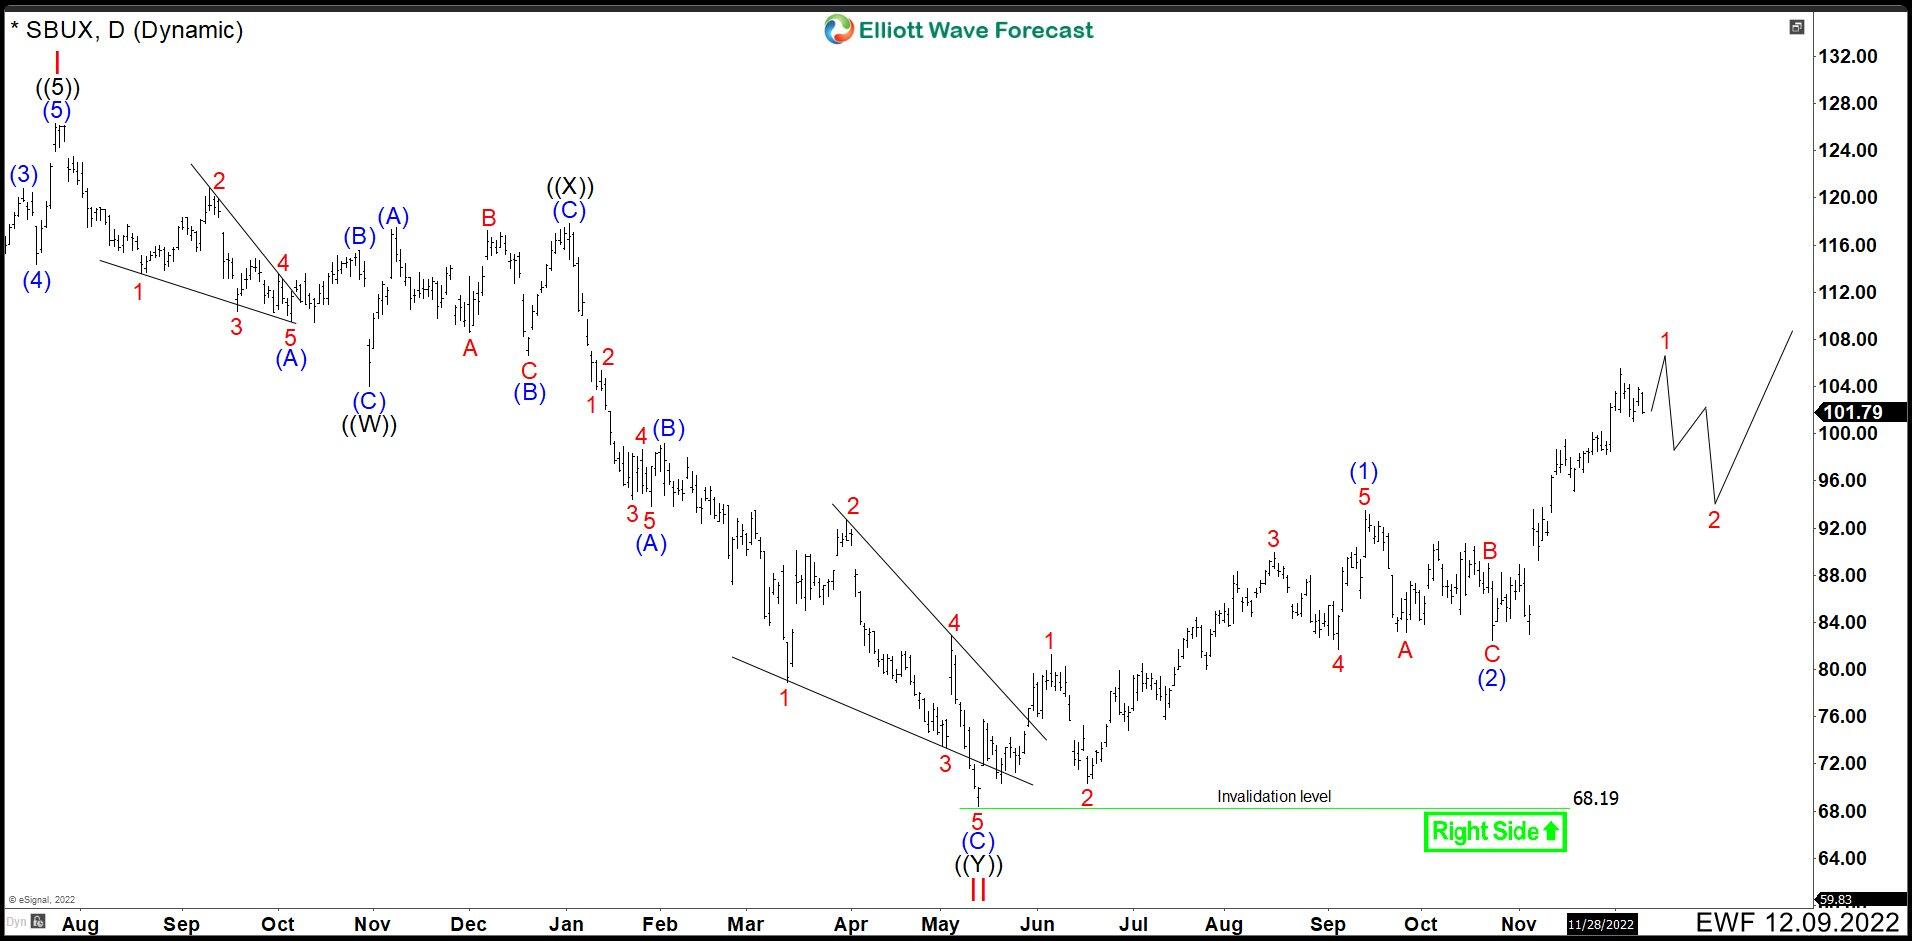
Starbucks (SBUX) bounced from the May low ended an impulse at $93.63 as wave (1). After this, a flat correction appeared making 3 swings pullback where wave B was a triangle. Wave (2) ended at $82.50. The rally continued and we expected that wave 1 in red finishes soon and then see 3, 7 or 11 swings correction to complete wave 2 and continue with the uptrend.
Starbucks (SBUX) Elliott Wave analysis – June daily chart
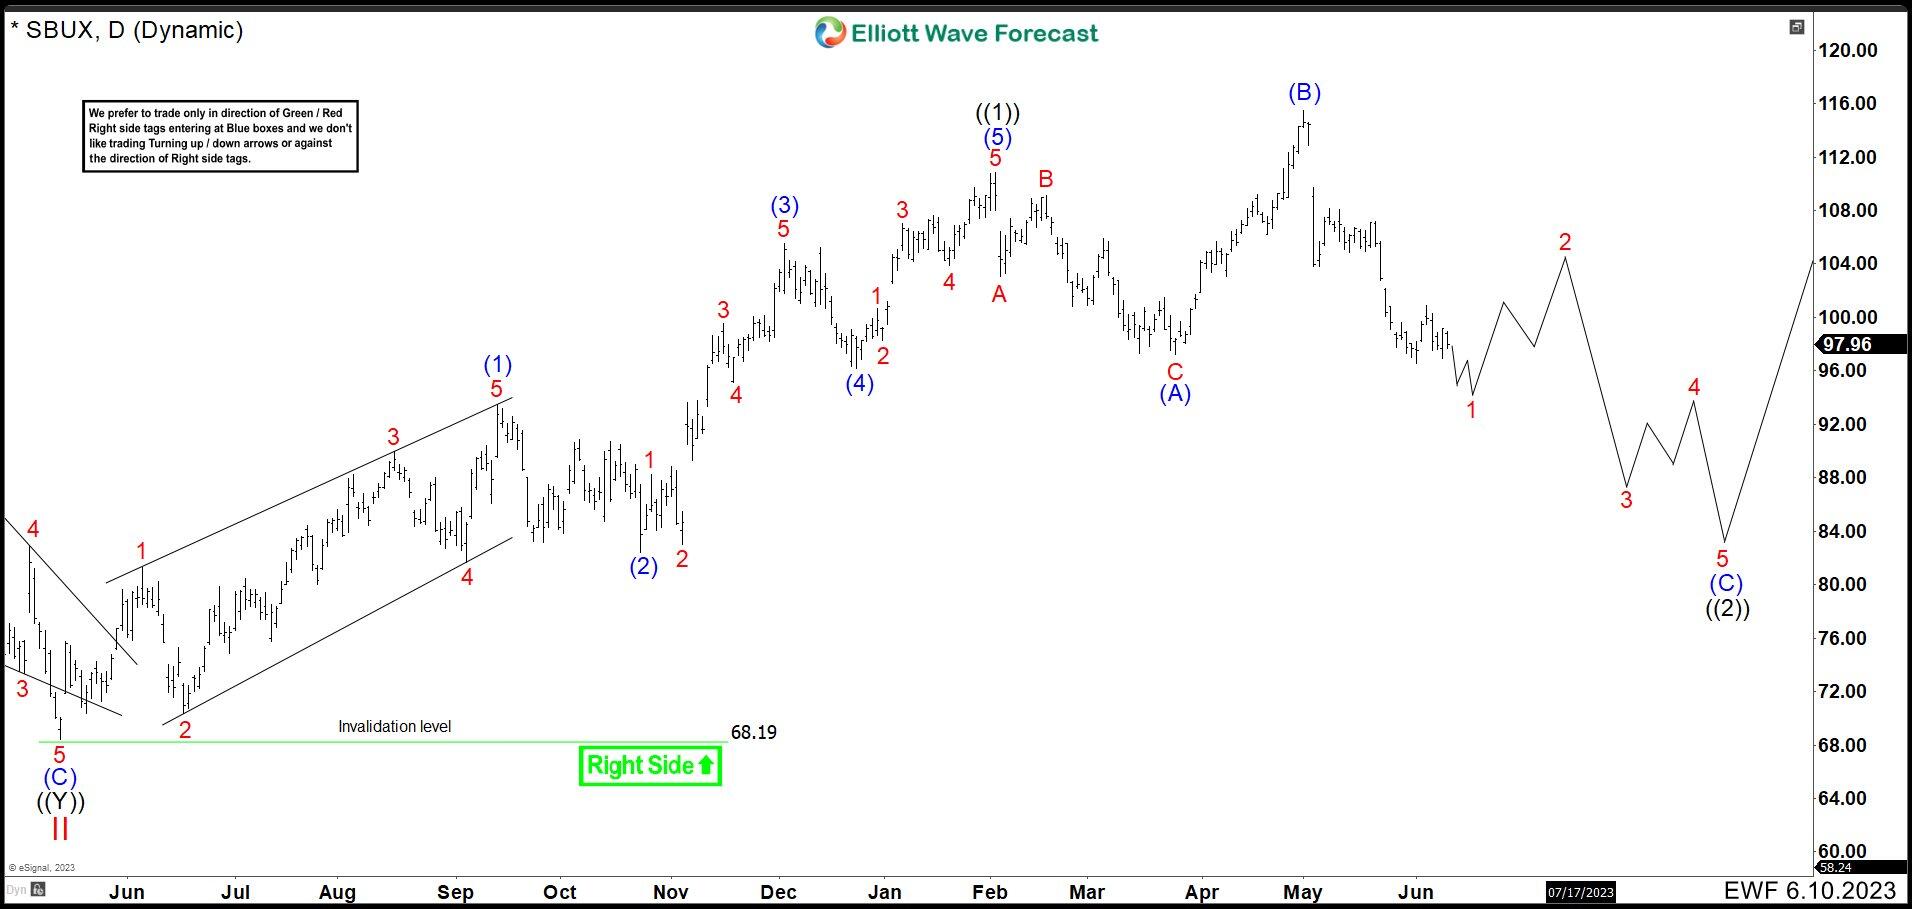
The path followed as expected, but the correction that began in February damaged the possibility of continuing the rally for now. Therefore, we have adjusted the count. We can clearly count 5 waves from May 2022 low that ended at $110.83. We call this structure wave ((1)). Then, the fall from February high ended at $97.19 completing wave (A). This correction could have been the end of the wave ((2)) and continue the rally; howerver, the price action has denied it. The bounce from the end of the wave (A) is part of an expanded flat correction. This one reached $115.48 finishing the wave (B).
Currently, the share price of SBUX has broken below $97.19, indicating that the correction could continue. That is why the most convenient structure to follow is an expanded flat. Wave ((C)) should build a bearish impulse or ending diagonal, as indicated on the chart, to finish wave ((2)) and look to continue the rally.
Author

Elliott Wave Forecast Team
ElliottWave-Forecast.com


