SPX in all-time bullish sequence – When is next pullback?

In this post, we will examine the SPX all-time bullish trend and predict the next significant pullback.
The index is close to breaking into a new all-time high, with several such moments already in 2024. In a strong trend like this, the key question is: when is the next correction? This post will answer that using the S&P 500 charts we shared with ElliottWave Forecast members.
SPX EWF weekend update – Weekly chart – 06/29/2024
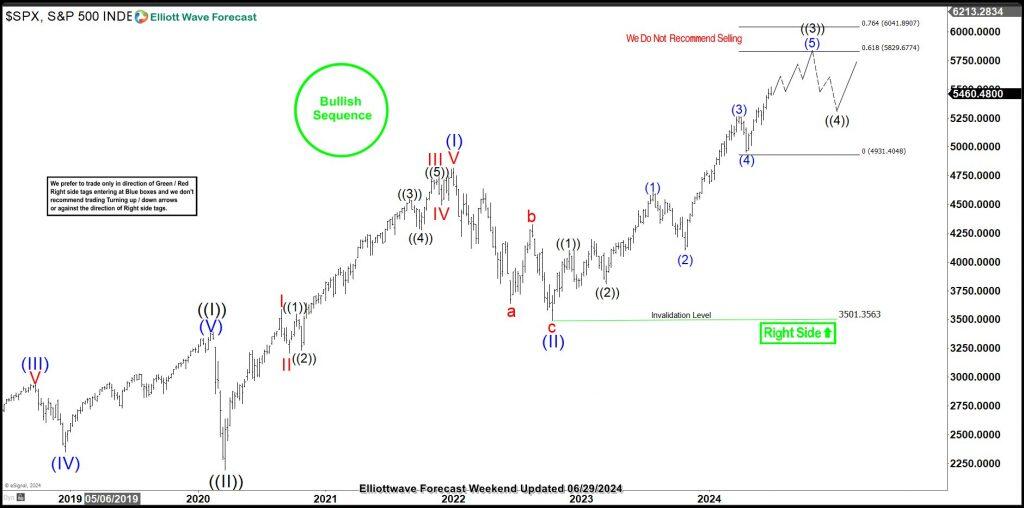
We shared the above weekly chart on 06.29.2024. The chart shows the S&P 500’s long-term path from its all-time low. From an Elliott wave perspective, the index is evolving into a bullish impulse cycle from the all-time low. Wave ((I)) of the grand supercycle degree ended at the peak of February 2020. The pullback for wave ((II)) followed, reaching the March 2020 low during the COVID-19 shock. The recovery from the March 2020 low marked the evolution of wave ((III)). However, the index is far from completing wave ((III)).
Wave (I) of ((III)) ended at the peak of January 2022, followed by a pullback for wave (II) of ((III)), which finished at the low of October 2022. Currently, the price is in wave (III) of ((III)). Specifically, the index is in wave ((3)) of I of (III) from the 3501.3563 low of October 2022. Wave ((3)) has not yet concluded. Price is in wave (5) of ((3)), projected to complete between 5829-6041. Since wave (5) has not yet concluded, we can expect the next significant pullback on the lower time frame when wave (5) completes its 2nd or 4th sub-wave. We can examine this on lower time frame charts like the H4.
SPX EWF update – Four-hour chart – 07/02/2024
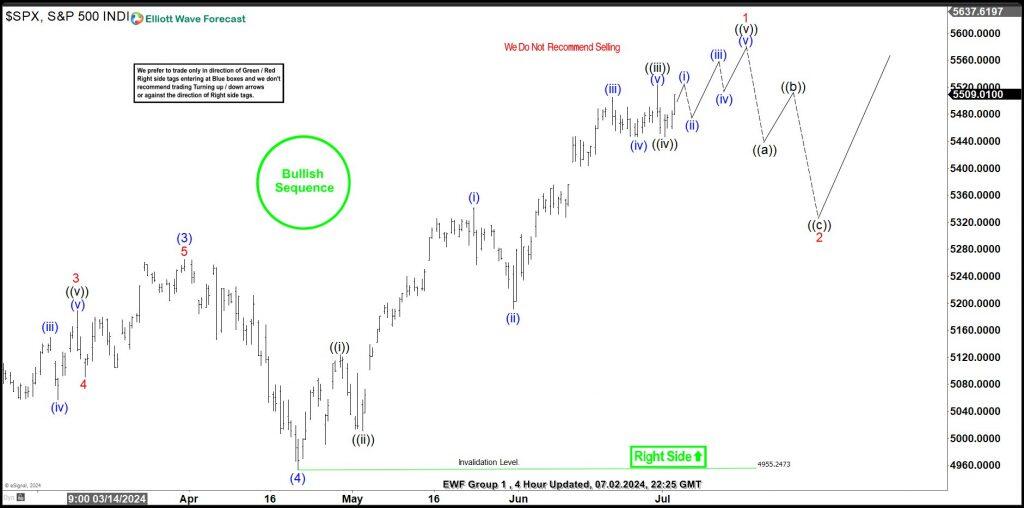
At the time of writing, the H4 chart above was the latest update shared with members. We update the H4 charts for all 78 instruments we cover after the New York session closes and before the Asian markets open. The H4 chart shows the price in wave 1 of (5). The next major pullback will happen when wave 1 completes and wave 2 follows, then buyers will get attracted again. Meanwhile, the index appears to have completed wave ((iv)) of 1 and is now in the final phase for wave ((v)) of 1 from the low of July 1, 2024. As wave ((v)) progresses, traders can buy pullbacks on the H1 or 30-minute chart in 3, 7, or 11 swings. We update H1/30 min charts four times a day for members.
These updates can present trade opportunities, especially waves (ii) and (iv) of ((v)). Meanwhile, the key trade for swing traders will be after the pullback for wave 2 in 3,7 or 11 swings at the extreme. Meanwhile, members can check the trade room for trade opportunities across all the time frames on all the 78 instruments covered.
Author

Elliott Wave Forecast Team
ElliottWave-Forecast.com


