Spotify Technology S.A. (SPOT) Elliott Wave technical analysis [Video]
![Spotify Technology S.A. (SPOT) Elliott Wave technical analysis [Video]](https://editorial.fxstreet.com/images/TechnicalAnalysis/ChartPatterns/Chartism/mobile-phone-with-stock-chart-62799468_XtraLarge.jpg)
SPOT Elliott Wave technical analysis
-
Function: Trend.
-
Mode: Impulsive.
-
Structure: Motive.
-
Position: Wave 5 of (1).
-
Direction: Upside within wave 5.
- Details: With ongoing pullbacks occurring in three-wave patterns, the outlook remains bullish for further upside within Minor wave 5, potentially targeting the $500 level.
Spotify Technology S.A. (SPOT) – Daily chart
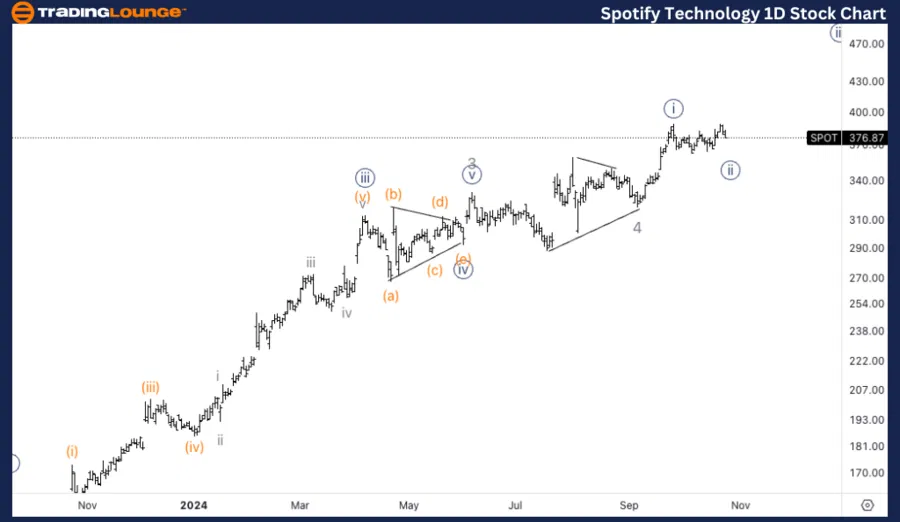
SPOT Elliott Wave technical analysis
-
Function: Trend.
-
Mode: Impulsive.
-
Structure: Motive.
-
Position: Wave {ii} of 5.
-
Direction: Seeking a bottom in wave {ii}.
-
Details: Evidence suggests wave {ii} may still be unfolding, as the latest upward movement aligns with a three-wave structure. This could imply a final leg lower before the upward trend resumes in wave {iii} of 5.
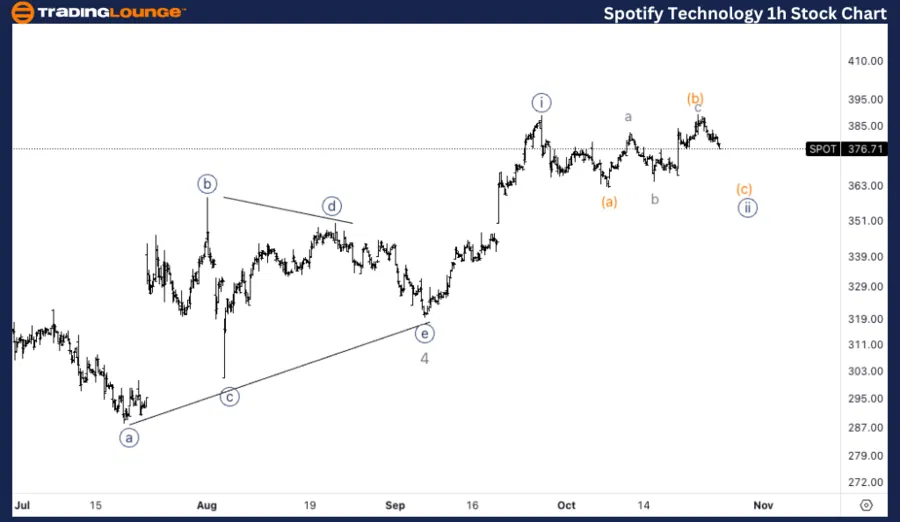
Spotify Technology S.A. (SPOT) – One-hour chart
This analysis examines Spotify Technology S.A. (SPOT) on both daily and 1-hour charts, applying Elliott Wave Theory to analyze current trends and anticipate future price direction.
-
Daily Chart: SPOT is advancing within Minor wave 5 of (1) on the daily timeframe, maintaining a three-wave pullback formation. This suggests the upward trajectory in wave 5 remains valid, with a potential target around $500.
-
1H Chart: The 1-hour chart indicates that wave {ii} may still be developing, with an additional minor pullback expected before continuing upward in wave {iii} of 5.
Spotify Technology S.A. (SPOT) Elliott Wave technical analysis [Video]
Author

Peter Mathers
TradingLounge
Peter Mathers started actively trading in 1982. He began his career at Hoei and Shoin, a Japanese futures trading company.


