SPOT Elliott Wave technical analysis
Function: Trend.
Mode: Impulsive.
Structure: Motive.
Position: Minor 5.
Direction: Upside in Minor 5.
Details: Looking for upside into Minor wave 5, 0.618 5 vs. 1 stands at 500$. It’s also possible we have had wave {iv} instead of 4.
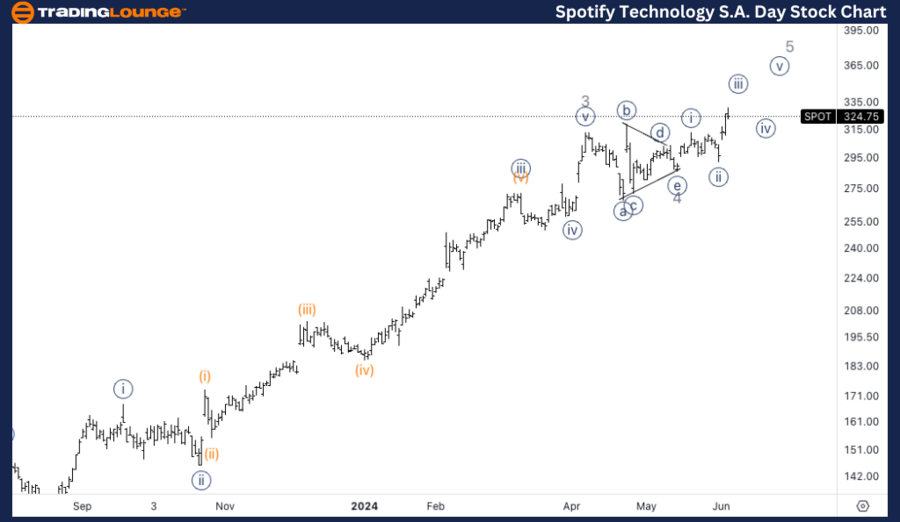
SPOT Elliott Wave technical analysis – Daily chart
In our Elliott Wave analysis of Spotify Technology S.A. (SPOT), we observe an impulsive trend characterized by a motive structure. SPOT is currently positioned in Minor wave 5, suggesting an upside movement. The target for 0.618 of wave 5 vs. wave 1 stands at $500. Additionally, there is a possibility that we have seen wave {iv} instead of wave 4, indicating the potential for further upward movement. Traders should monitor for continuation signals to confirm the development of Minor wave 5.
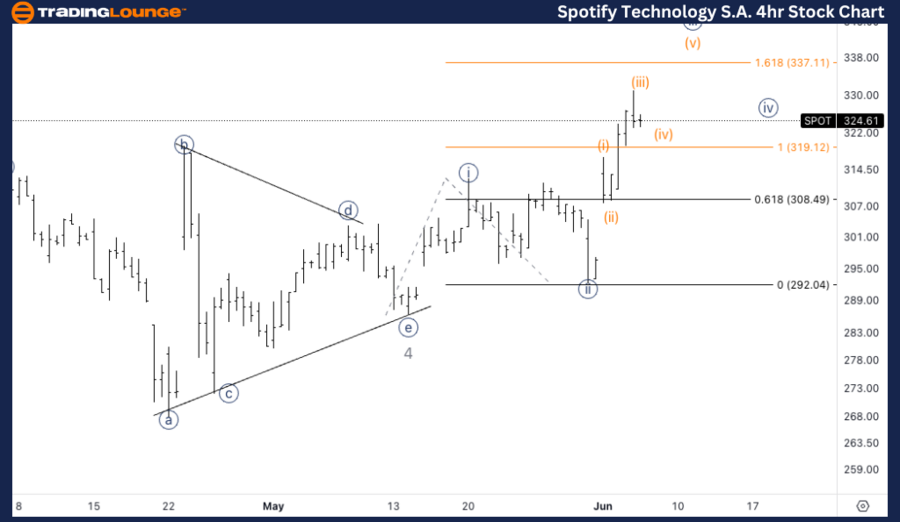
SPOT Elliott Wave technical analysis – Four-hour chart
On the 4-hour chart, SPOT is following an impulsive trend within a motive structure, specifically in wave {iii}. The current analysis indicates that wave {iii} is unfolding nicely towards the end of MG2 at $330, with the 1.618 projection of wave {iii} vs. wave {i} at $337. Traders should watch for completion patterns in wave {iii} and potential consolidation before wave {iv} begins.
Function: Trend.
Mode: Impulsive.
Structure: Motive.
Position: Wave {iii}.
Direction: Completion in {iii}.
Details: Looking for wave {iii} to unfold nicely towards the end of MG2 at 330$, with 1.618 {iii} vs. {i} at 337$.
Welcome to our latest Elliott Wave analysis for Spotify Technology S.A. (SPOT) as of June 6, 2024. This analysis provides an in-depth look at SPOT's price movements using the Elliott Wave Theory, helping traders identify potential opportunities based on current trends and market structure. We will cover insights from both the daily and 4-hour charts to offer a comprehensive perspective on SPOT's market behavior.
Spotify Technology S.A. (SPOT) Elliott Wave technical analysis [Video]
As with any investment opportunity there is a risk of making losses on investments that Trading Lounge expresses opinions on.
Historical results are no guarantee of future returns. Some investments are inherently riskier than others. At worst, you could lose your entire investment. TradingLounge™ uses a range of technical analysis tools, software and basic fundamental analysis as well as economic forecasts aimed at minimizing the potential for loss.
The advice we provide through our TradingLounge™ websites and our TradingLounge™ Membership has been prepared without considering your objectives, financial situation or needs. Reliance on such advice, information or data is at your own risk. The decision to trade and the method of trading is for you alone to decide. This information is of a general nature only, so you should, before acting upon any of the information or advice provided by us, consider the appropriateness of the advice considering your own objectives, financial situation or needs. Therefore, you should consult your financial advisor or accountant to determine whether trading in securities and derivatives products is appropriate for you considering your financial circumstances.
Recommended content
Editors’ Picks
EUR/USD retreats from daily highs, holds above 1.0800
![EUR/USD retreats from daily highs, holds above 1.0800](https://editorial.fxstreet.com/images/Markets/Currencies/Majors/EURUSD/money-59004818_XtraSmall.jpg)
EUR/USD loses traction but holds above 1.0800 after touching its highest level in three weeks above 1.0840. Nonfarm Payrolls in the US rose more than expected in June but downward revisions to May and April don't allow the USD to gather strength.
GBP/USD struggles to hold above 1.2800 after US jobs data
![GBP/USD struggles to hold above 1.2800 after US jobs data](https://editorial.fxstreet.com/images/Markets/Currencies/Majors/GBPUSD/british-banknotes-14144912_XtraSmall.jpg)
GBP/USD spiked above 1.2800 with the immediate reaction to the mixed US jobs report but retreated below this level. Nonfarm Payrolls in the US rose 206,000 in June. The Unemployment Rate ticked up to 4.1% and annual wage inflation declined to 3.9%.
Gold approaches $2,380 on robust NFP data
![Gold approaches $2,380 on robust NFP data](https://editorial.fxstreet.com/images/Markets/Commodities/Metals/Gold/stack-of-golden-bars-in-the-bank-vault-60756080_XtraSmall.jpg)
Gold intensifies the bullish stance for the day, rising to the vicinity of the $2,380 region following the publication of the US labour market report for the month of June. The benchmark 10-year US Treasury bond yield stays deep in the red near 4.3%, helping XAU/USD push higher.
Crypto Today: Bitcoin, Ethereum and Ripple lose key support levels, extend declines on Friday
![Crypto Today: Bitcoin, Ethereum and Ripple lose key support levels, extend declines on Friday](https://editorial.fxstreet.com/images/Markets/Currencies/Digital%20Currencies/Bitcoin/Bitcoin_2_XtraSmall.jpg)
Crypto market lost nearly 6% in market capitalization, down to $2.121 trillion. Bitcoin (BTC), Ethereum (ETH) and Ripple (XRP) erased recent gains from 2024.
French Elections Preview: Euro to “sell the fact” on a hung parliament scenario Premium
![French Elections Preview: Euro to “sell the fact” on a hung parliament scenario](https://editorial.fxstreet.com/images/Macroeconomics/Countries/Europe/Eurozone_countries/France/pantheon-paris-with-french-flag-8748101_XtraSmall.jpg)
Investors expect Frances's second round of parliamentary elections to end with a hung parliament. Keeping extremists out of power is priced in and could result in profit-taking on Euro gains.