SPOT Elliott Wave technical analysis [Video]
![SPOT Elliott Wave technical analysis [Video]](https://editorial.fxstreet.com/images/Markets/Equities/Industries/Media/AMC/AMC_stock_mobile_candle_chart_XtraLarge.jpg)
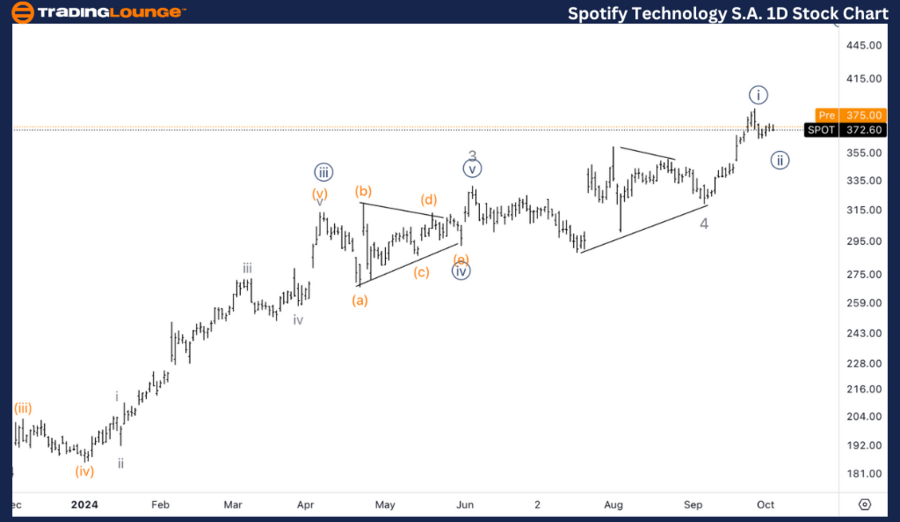
SPOT Elliott Wave Analysis Trading Lounge Daily Chart,
Spotify Technology S.A., (SPOT) Daily Chart.
SPOT Elliott Wave technical analysis
Function: Trend.
Mode: Impulsive.
Structure: Motive.
Position: Wave 5.
Direction: Completion in wave 5.
Details: We are now trading within MinorGroup2 of 300$, specifically around 372$ and 380$. Looking for further upside within wave 5 towards the next TradingLevel at 500$.
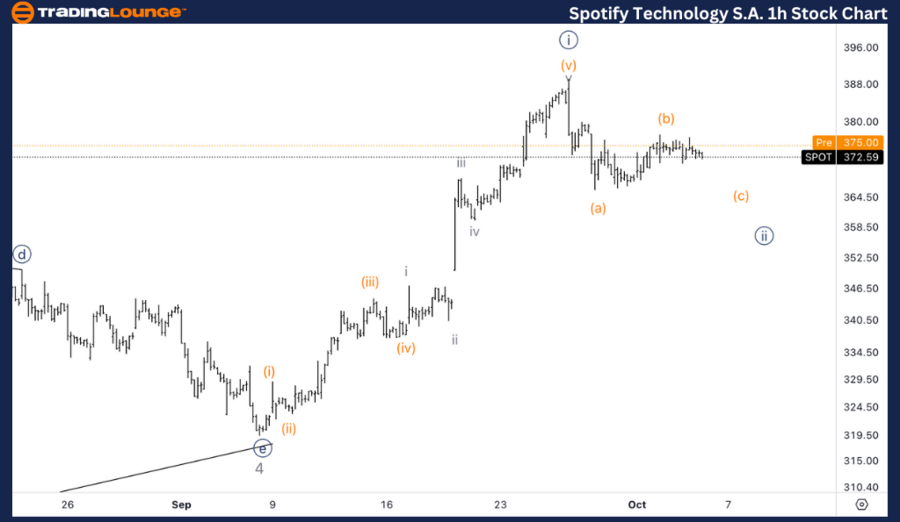
Spotify Technology S.A.,(SPOT) 1H Chart.
SPOT Elliott Wave technical analysis
Function: Trend.
Mode: Impulsive.
Structure: Motive.
Position: Wave {i} of 5.
Direction: Looking for a bottom in wave{ii}.
Details: Looking for a bottom in wave {ii} of 5 to then resume higher within Minor wave 5.
This analysis of Spotify Technology S.A. (SPOT) focuses on both the daily and 1-hour charts, using the Elliott Wave Theory to assess current market trends and forecast future price movements.
SPOT Elliott Wave technical analysis – Daily chart
On the daily chart, SPOT is progressing through Wave 5 of an impulsive structure. Currently, the stock is trading within MinorGroup2, between $372 and $380. The next major upside target lies at TradingLevel 500, which suggests that there is significant room for further gains within Wave 5.
Given that SPOT is advancing through the final wave of the current structure, traders should watch for potential consolidations as the stock nears key psychological levels like $400 on its journey toward $500. However, the overall bullish momentum remains strong, suggesting continued upside potential.
SPOT Elliott Wave technical analysis – One-hour chart
On the 1-hour chart, SPOT is in the early stages of Wave 5 and is currently forming Wave {ii} of 5. The market is looking for a bottom in Wave {ii}, which, once confirmed, should lead to a resumption of the upward movement within Wave 5.
This could present an ideal buying opportunity for those looking to capitalize on the completion of Wave {ii} and the subsequent move higher. The next upside targets should be around $400 in the near term, before further extension toward the longer-term target at $500.
Technical analyst: Alessio Barretta.
SPOT Elliott Wave technical analysis [Video]
Author

Peter Mathers
TradingLounge
Peter Mathers started actively trading in 1982. He began his career at Hoei and Shoin, a Japanese futures trading company.


