- S&P 500 rises strongly on hopes for a diplomatic solution to Russia-Ukraine.
- High growth and retail stocks outperform value as they play catch up.
- The macroeconomic backdrop remains challenging as yields remain elevated.
The main US indices, indeed most global indices, closed up on Tuesday as investors reacted positively to news reports that Russia had returned some troops to its bases. This allowed risker assets to recover, while traditional safe havens like the dollar and gold lost some ground. The S&P 500 (SPY) closed up 1.5%, The Dow closed higher by 1.3% while the Nasdaq was the top performer with a gain of 2.5% on Tuesday.
S&P 500 Stock News
The top sector on Tuesday was obviously technology with the XLK Technology ETF gaining 2.6%, while the energy sector (XLE) lagged, losing 1.05%. This was understandable as oil dropped on a reduction in Russia-Ukraine tensions. The market may have had a strong risk-on rally yesterday, but the macro backdrop remains the same.
Tuesday's PPI data will only have reinforced recent moves in fixed-income markets, and increased central bank tightening and higher yields remain the main macro factors at play. This may make any rallies such as that seen yesterday difficult to maintain. In such an environment choppy trading is likely with elevated volatility. This heightened volatility is also the result of the multitude of Russia-Ukraine headlines.
The main data set today is US retail sales. These will need to show continued health from the US consumer and avoid any thoughts of stagflation or recession. Longer-term investors should note the US yield curve, which has been continuously flattening. The yield curve has a near 100% record in predicting US recessions going back 50 years.
S&P 500 Stock Forecast
As mentioned, our key medium-term pivots are $458 and $428. In between, we have choppy and volatile trading.
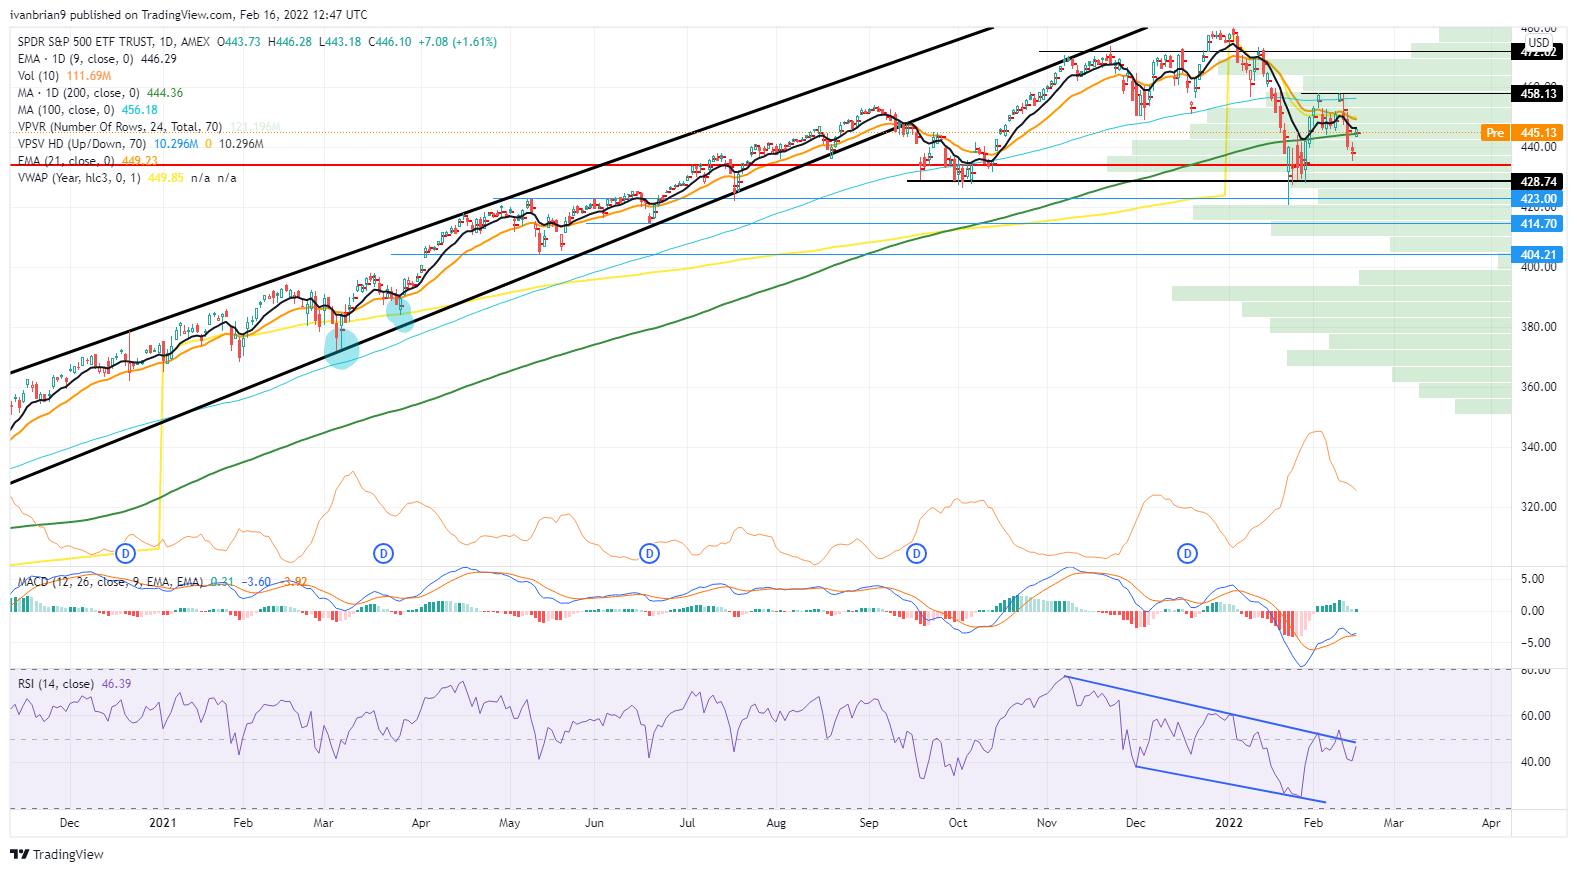
SPY chart, daily
What is more interesting from a swing trading perspective is the tiny range we had yesterday in the S&P 500 (SPY). The SPY merely gapped up on the open and did very little else for the day. This shows a lack of conviction in our view on the part of bulls. For today then, $443 is key. A break below is bearish in our view and should lead to a test of weekly lows at $435.
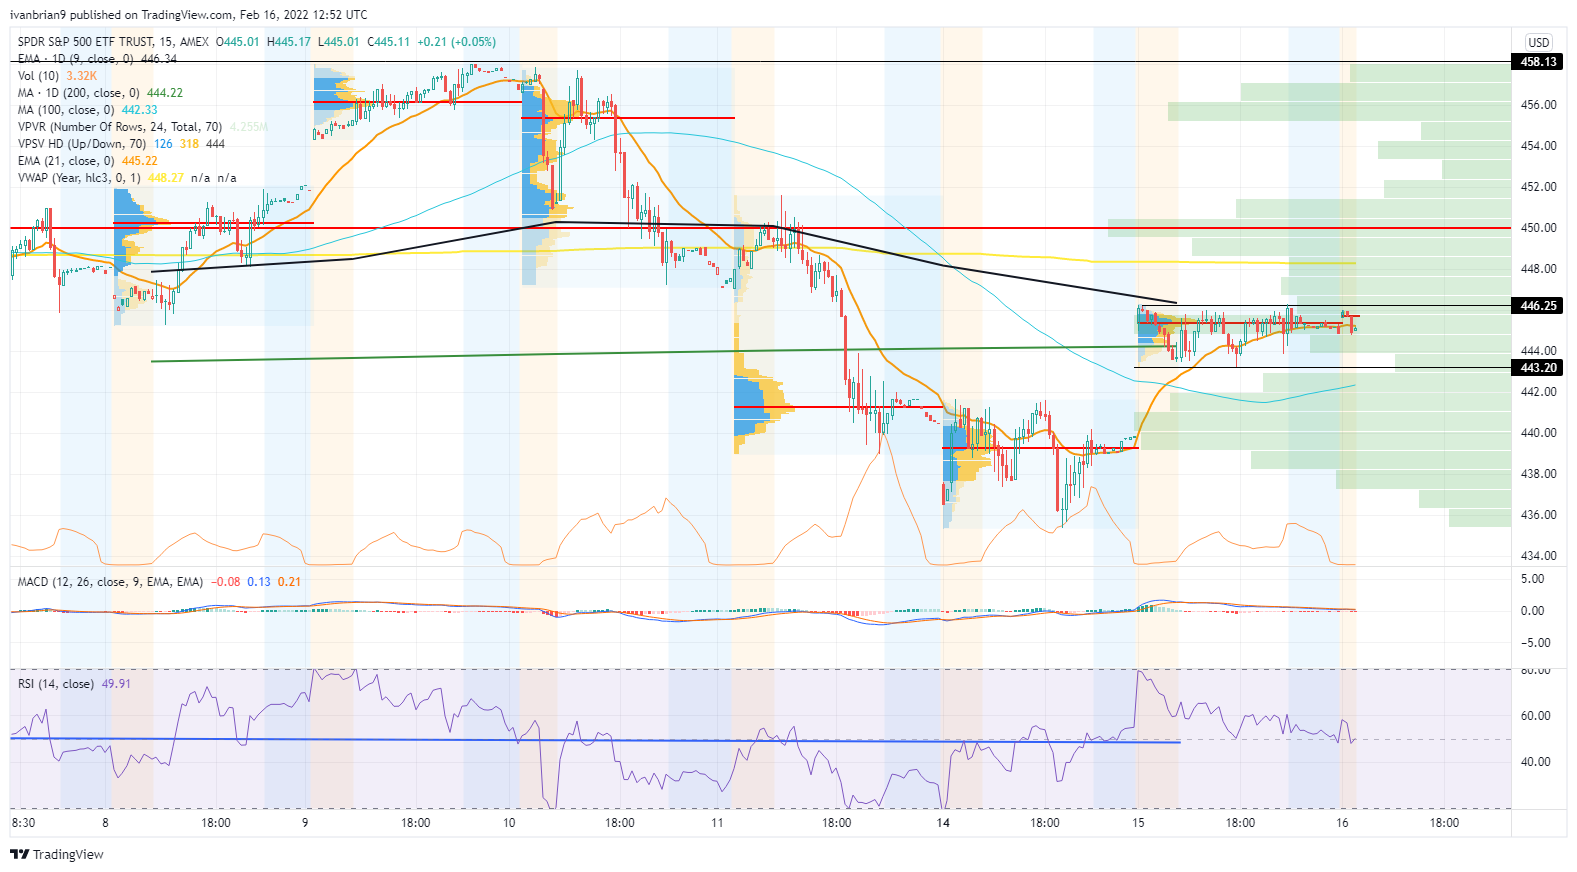
SPY chart, 15-minute
Information on these pages contains forward-looking statements that involve risks and uncertainties. Markets and instruments profiled on this page are for informational purposes only and should not in any way come across as a recommendation to buy or sell in these assets. You should do your own thorough research before making any investment decisions. FXStreet does not in any way guarantee that this information is free from mistakes, errors, or material misstatements. It also does not guarantee that this information is of a timely nature. Investing in Open Markets involves a great deal of risk, including the loss of all or a portion of your investment, as well as emotional distress. All risks, losses and costs associated with investing, including total loss of principal, are your responsibility. The views and opinions expressed in this article are those of the authors and do not necessarily reflect the official policy or position of FXStreet nor its advertisers. The author will not be held responsible for information that is found at the end of links posted on this page.
If not otherwise explicitly mentioned in the body of the article, at the time of writing, the author has no position in any stock mentioned in this article and no business relationship with any company mentioned. The author has not received compensation for writing this article, other than from FXStreet.
FXStreet and the author do not provide personalized recommendations. The author makes no representations as to the accuracy, completeness, or suitability of this information. FXStreet and the author will not be liable for any errors, omissions or any losses, injuries or damages arising from this information and its display or use. Errors and omissions excepted.
The author and FXStreet are not registered investment advisors and nothing in this article is intended to be investment advice.
Recommended content
Editors’ Picks
EUR/USD recovers toward 1.0500 after mixed US PMI data
EUR/USD rebounds toward 1.0500 in the American session on Friday after the data from the US showed that the business activity in the private sector expanded at a softer pace than anticipated in early February. The pair remains on track to end the week with little changed.
GBP/USD rises above 1.2650, looks to post weekly gains
GBP/USD regains its traction and trades above 1.2650 in the second half of the day on Friday. The data from the US showed that the S&P Global Services PMI dropped into the contraction territory below 50 in February, causing the US Dollar to lose strength and helping the pair edge higher.
Gold holds above $2,930 as US yields edge lower
Gold holds above $2,930 after correcting from the record-high it set above $2,950 on Thursday. Following the mixed PMI data from the US, the benchmark 10-year US Treasury bond yield stays in negative territory below 4.5% and allows XAU/USD to hold its ground.
Crypto exchange Bybit hacked for $1.4 billion worth of ETH
Following a security breach first spotted by crypto investigator ZachXBT, crypto exchange Bybit announced that it suffered a hack where an attacker compromised one of its ETH wallets.
Money market outlook 2025: Trends and dynamics in the Eurozone, US, and UK
We delve into the world of money market funds. Distinct dynamics are at play in the US, eurozone, and UK. In the US, repo rates are more attractive, and bills are expected to appreciate. It's also worth noting that the Fed might cut rates more than anticipated, similar to the UK. In the eurozone, unsecured rates remain elevated.
The Best brokers to trade EUR/USD
SPONSORED Discover the top brokers for trading EUR/USD in 2025. Our list features brokers with competitive spreads, fast execution, and powerful platforms. Whether you're a beginner or an expert, find the right partner to navigate the dynamic Forex market.