|

SP500 bounces off most important line on the market

On the market, there is currently one line in the center of attention of the majority of technical traders in the world. This line is the long-term down trendline (red) on the SP500 that stopped the bullish advances again this week!

The down trendline has been connecting lower tops since the beginning of 2022. It worked in March, August, November, and December; and it also worked now. We have to add that the most recent flirting with this resistance has been more intense than in the first half of 2022. In December, the price almost broke this down trendline, but the bullish attack was stopped and the price created a handsome shooting star candle (yellow). This event sorted the sentiment for the rest of the year and for the rest of December, with SP500 mostly going lower.

Chart

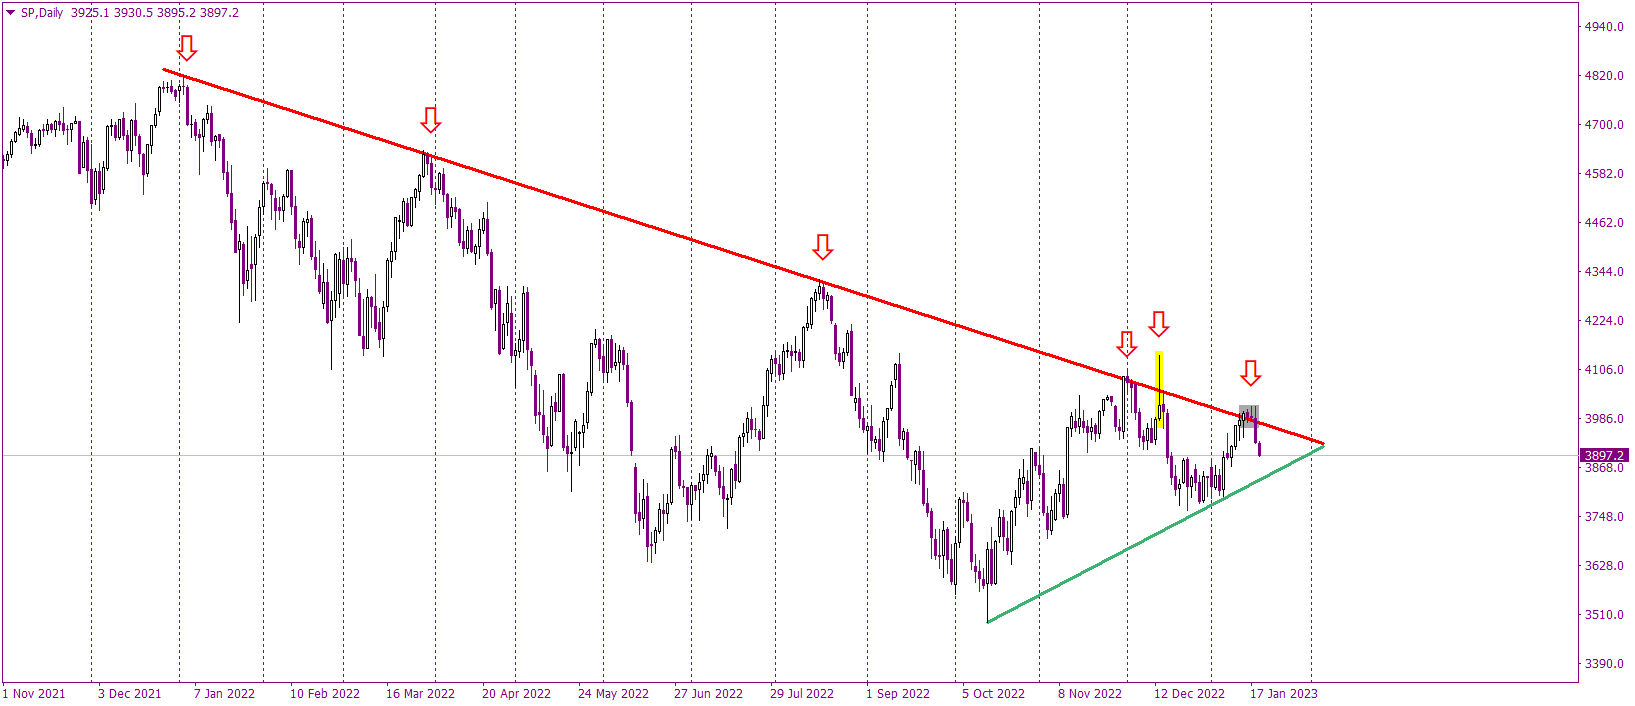
In the past few days, SP500 almost broke the down trendline again. Almost is a keyword here because there was no decisive breakout above that resistance. Yesterday’s hawkish comments from the FED officials negatively influenced the stock market and the indices collapsed. The price is now in freefall and instead of threatening the resistance, it is approaching support.

The closest support is the green, mid-term up trendline, connecting higher lows since the occurrence of the bottom that was established in the middle of October. Price breaking that support would be a scary sell signal and buyers should avoid it at all costs. Red and green lines are approaching each other, so the time for the breakout is getting closer and closer. It should probably happen in the next two weeks and the direction of the breakout will dictate the direction for the next months.

Author

Tomasz Wisniewski

Tomasz Wisniewski

Axiory Global Ltd.

Tomasz was born in Warsaw, Poland on 25th October, 1985.

More from Tomasz Wisniewski
Share:

Editor's Picks

EUR/USD shifts its attention to 1.1900 and above

EUR/USD has shaken off Tuesday’s dip, pushing back beyond the 1.1800 mark amid decent gains as  Wednesday’s session draws to a close. The rebound is largely driven by a modest pullback in the US Dollar, as markets digest the aftermath of President Trump’s SOTU speech and continue to monitor trade-related headlines and signals from the White House.
 

GBP/USD challenges multi-day highs near 1.3530

GBP/USD leaves behind the previous day’s decline and regains fresh upside traction on Wednesday, surpassing the 1.3500 barrier in a context of a modest decline in the Greenback and a generalised improved mood in the risk-linked space. Meanwhile, the US tariff narrative continues to dictate the mood among market participants after Presidet Trump’s SOTU speech failed to surprise markets.

Gold remains bid and close to $5,200

Gold buyers are returning to the fold on Wednesday, targeting the $5,200 area and possibly beyond, after Tuesday’s corrective dip from monthly highs. The rebound in the precious metal comes as the US Dollar loses traction, with Trump’s SOTU speech offering little fresh direction and AI-related nerves continuing to ease.

UK financial watchdog advances stablecoin oversight as four firms pilot issuance

The Financial Conduct Authority (FCA) in the United Kingdom (UK) is advancing toward the final stablecoin regulatory framework with a pilot program involving four companies, including Monee, Financial Technologies ReStabilise, Revolut and VVTX.

Nvidia earnings to influence AI trade and broader market sentiment

For the last three years, Nvidia has been the engine of the AI boom, and now Wall Street is watching to see whether that momentum can keep going. High-growth stocks have been struggling to maintain their bullish trend in 2026.

Cosmos Hub Price Forecast: ATOM rebounds slightly, bearish outlook remains intact

Cosmos Hub (ATOM) price rebounds, trading above $2.05 at the time of writing on Wednesday, after undergoing a sharp correction since last week. Weakening on-chain and derivatives data support a bearish outlook, while technical analysis remains unfavorable.