S&P/TSX 60 Index Elliott Wave technical analysis [Video]
![S&P/TSX 60 Index Elliott Wave technical analysis [Video]](https://editorial.fxsstatic.com/images/i/Equity-Index_S&P500-2_XtraLarge.jpg)
S&P/TSX 60 Elliott Wave technical analysis
Technical overview
-
Function: Trend.
-
Mode: Impulsive.
-
Structure: Orange Wave 5.
-
Position: Navy Blue Wave 3.
-
Direction next lower degrees: Navy Blue Wave 4.
-
Details:
-
Orange Wave 4 appears completed.
-
Orange Wave 5 is currently developing.
-
Wave cancellation invalid level: 1,463.86.
-
S&P/TSX 60 Elliott Wave analysis overview
The S&P/TSX 60 Elliott Wave Analysis on the daily chart presents a detailed technical perspective on the index’s current trend.
Market trend and structure
-
The analysis identifies the market as being in an impulsive mode, indicating a strong and sustained directional movement.
-
The current structure is labeled as Orange Wave 5, which is a sub-wave within Navy Blue Wave 3, part of a larger Elliott Wave cycle.
Key observations
-
Orange Wave 4 appears to have completed, and Orange Wave 5 is now in progress, signaling continued upward momentum.
-
The next anticipated move at a lower degree is Navy Blue Wave 4, typically a corrective phase following the completion of an impulsive wave.
-
Traders should closely monitor Orange Wave 5, as its completion may trigger the start of Navy Blue Wave 4.
-
The wave cancellation invalid level is set at 1,463.86, meaning if the price falls below this level, the current wave count becomes invalid, requiring a revised analysis.
Conclusion
The S&P/TSX 60 is currently in an impulsive phase, labeled as Orange Wave 5, within a larger trend inside Navy Blue Wave 3. The completion of Orange Wave 4 has set the stage for a continuation of the current trend.
Traders should monitor the progression of this wave and observe the invalidation level at 1,463.86 to confirm the wave structure’s validity. This analysis provides a structured framework to understand the market’s current position and anticipate future price movements within the ongoing trend.
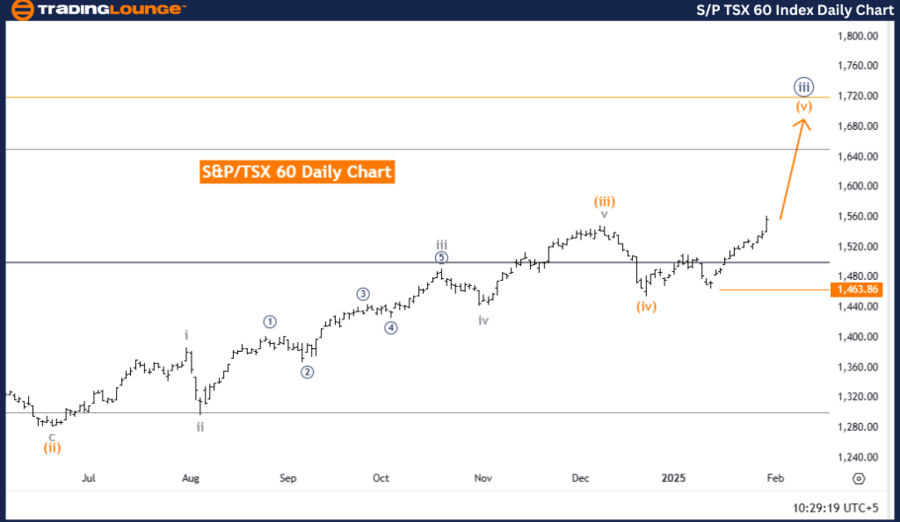
S&P/TSX 60 Elliott Wave Analysis – Day Chart
S&P/TSX 60 Elliott Wave technical analysis
Technical overview
-
Function: Trend.
-
Mode: Impulsive.
-
Structure: Orange Wave 5.
-
Position: Navy Blue Wave 3.
-
Direction next lower degrees: Navy Blue Wave 4.
-
Details:
-
Orange Wave 4 appears completed.
-
Orange Wave 5 is currently developing.
-
Wave cancellation invalid level: 1,463.86.
-
S&P/TSX 60 Elliott Wave analysis overview
The S&P/TSX 60 Elliott Wave Analysis on the weekly chart provides a comprehensive technical perspective on the index’s current trend.
Market trend and structure
-
The analysis identifies the market as being in an impulsive mode, indicating a strong and sustained directional movement.
-
The current structure is labeled as Orange Wave 5, which is a sub-wave within Navy Blue Wave 3, part of a larger Elliott Wave cycle.
Key observations
-
Orange Wave 4 appears to have completed, and Orange Wave 5 is now in progress, signaling continued upward momentum.
-
The next anticipated move at a lower degree is Navy Blue Wave 4, typically a corrective phase following the completion of an impulsive wave.
-
Traders should closely monitor Orange Wave 5, as its completion may trigger the start of Navy Blue Wave 4.
-
The wave cancellation invalid level is set at 1,463.86, meaning if the price falls below this level, the current wave count becomes invalid, requiring a revised analysis.
Conclusion
The S&P/TSX 60 is currently in an impulsive phase, labeled as Orange Wave 5, within a larger trend inside Navy Blue Wave 3. The completion of Orange Wave 4 has set the stage for a continuation of the current trend.
Traders should monitor the progression of this wave and observe the invalidation level at 1,463.86 to confirm the wave structure’s validity. This analysis provides a structured framework to understand the market’s current position and anticipate future price movements within the ongoing trend.
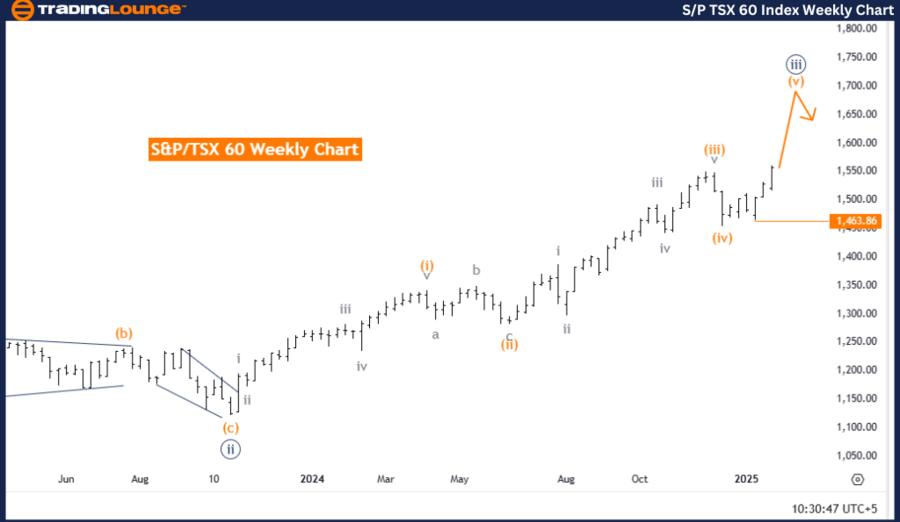
S&P/TSX 60 Elliott Wave analysis – Weekly chart
S&P/TSX 60 Index Elliott Wave technical analysis [Video]
Author

Peter Mathers
TradingLounge
Peter Mathers started actively trading in 1982. He began his career at Hoei and Shoin, a Japanese futures trading company.


