S&P/TSX 60 index Elliott Wave technical analysis [Video]
![S&P/TSX 60 index Elliott Wave technical analysis [Video]](https://editorial.fxstreet.com/images/Markets/Equities/display-panel-of-daily-stock-market-59908972_XtraLarge.jpg)
S&P/TSX 60 Elliott Wave Analysis - Trading Lounge.
S&P/TSX 60 Elliott Wave technical analysis
-
Function: Trend.
-
Mode: Impulsive.
-
Structure: Gray Wave 5.
-
Position: Orange Wave 3.
-
Direction (next lower degrees): Orange Wave 4.
Details:
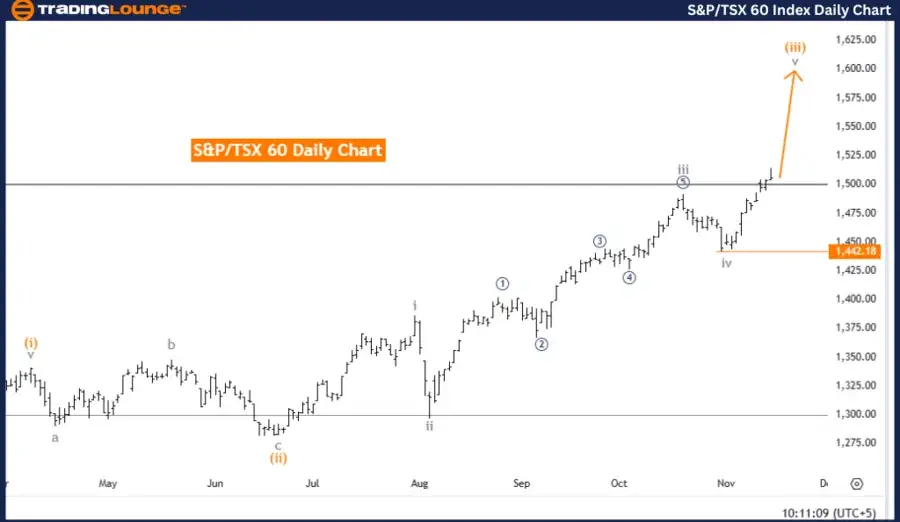
The analysis of the S&P/TSX 60 daily chart by Trading Lounge highlights a continuing upward trend within the Canadian stock index. The current structure follows an impulsive Elliott Wave formation, with gray wave 5 actively unfolding as part of the broader orange wave 3. This progression indicates sustained bullish momentum in the market.
Gray wave 4 of orange wave 3 appears to have completed, setting the stage for gray wave 5 to drive further gains.
Elliott Wave theory insights
-
Wave 5 in an impulsive structure often signals the final push within a trend, generally propelling prices higher before transitioning into a corrective phase.
-
In the context of orange wave 3, gray wave 5 aligns with the prevailing bullish sentiment. It is expected to lead the index higher before the anticipated orange wave 4 correction phase emerges.
Key level for wave invalidation
-
Critical Level: 1,442.18.
-
If the index falls to or below 1,442.18, the current wave count would be invalidated. This breach would suggest weakening bullish momentum and could signal a reversal.
This invalidation point is essential for traders as it acts as a checkpoint to assess the market's strength. A decline beyond this level would necessitate a reevaluation of the Elliott Wave structure and a potential shift in strategy.
Summary and market outlook
-
The S&P/TSX 60 Elliott Wave analysis presents a bullish trend outlook with gray wave 5 advancing within orange wave 3.
-
Additional upward movement is expected as gray wave 5 unfolds.
-
Traders should vigilantly monitor the 1,442.18 invalidation level. Any breach could disrupt the current bullish structure, signaling a possible reversal or a pause in the upward trajectory.
This level remains critical for confirming the strength and continuity of the bullish trend in the S&P/TSX 60 index.
S&P/TSX 60 Elliott Wave Analysis - Trading Lounge Weekly Chart
S&P/TSX 60 Elliott Wave technical analysis
-
Function: Trend.
-
Mode: Impulsive.
-
Structure: Navy Blue Wave 3.
-
Position: Gray Wave 5.
-
Direction (next lower degrees): Navy Blue Wave 4.
Details:
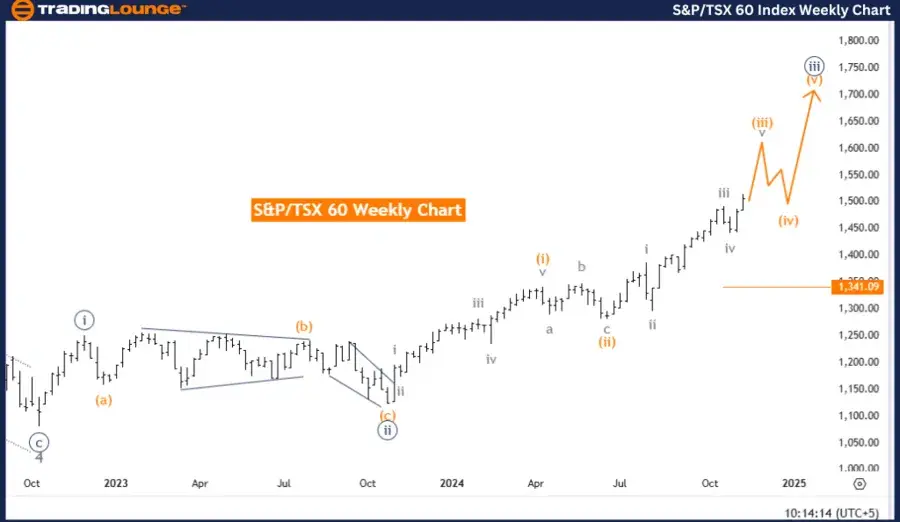
The S&P/TSX 60 weekly chart analysis by Trading Lounge highlights a continuing upward trend in the Canadian stock index. This trend is driven by an impulsive Elliott Wave formation, with navy blue wave 3 currently active. Within this broader wave, gray wave 5 is in progress, signaling sustained bullish momentum.
Following the completion of navy blue wave 2, navy blue wave 3 has emerged as a dominant force, reflecting an advancing trend. This configuration indicates further potential gains for the index as the current wave structure unfolds.
Elliott Wave theory insights
-
Wave 3 within an impulsive structure often represents a strong movement phase, marked by substantial upward momentum.
-
Gray wave 5, now progressing within navy blue wave 3, reinforces the bullish perspective, suggesting additional upward movement before the anticipated navy blue wave 4 corrective phase.
Key level for wave invalidation
-
Critical Level: 1,341.09
-
A decline to or below this level would invalidate the current wave structure, potentially weakening the bullish trend or signaling a reversal.
This invalidation point is vital for traders to assess market strength and momentum. Breaching this threshold could prompt a reevaluation of the Elliott Wave sequence and may indicate changing market dynamics.
Summary and market outlook
-
The S&P/TSX 60 Elliott Wave analysis on the weekly chart maintains a bullish outlook, with navy blue wave 3 propelling the market upward and gray wave 5 currently in play.
-
Medium-term projections indicate continued upward movement, supported by the current impulsive structure.
-
Traders should carefully watch the invalidation level at 1,341.09. Breaching this level could disrupt the bullish framework and suggest a potential shift in market direction.
This level serves as a critical reference point for validating the ongoing strength and persistence of the bullish trend in the S&P/TSX 60 index.
Technical analyst: Malik Awais.
S&P/TSX 60 Elliott Wave technical analysis [Video]
Author

Peter Mathers
TradingLounge
Peter Mathers started actively trading in 1982. He began his career at Hoei and Shoin, a Japanese futures trading company.


