S&P/TSX 60 Elliott Wave technical analysis [Video]
![S&P/TSX 60 Elliott Wave technical analysis [Video]](https://editorial.fxstreet.com/images/Markets/Equities/Industries/EnergyStocks/gas-electricity-637435385726449784_XtraLarge.jpg)
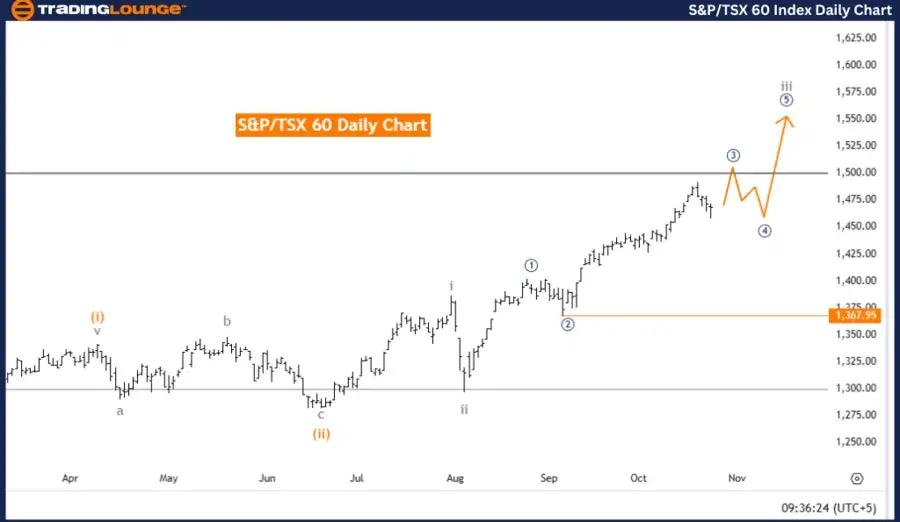
S&P/TSX 60 Elliott Wave Analysis - Trading Lounge Day Chart.
Instrument: S&P/TSX 60 - Day Chart.
Analysis Type: Elliott Wave technical analysis
Function: Bullish Trend.
Mode: Impulsive.
Wave structure: Micro Navy Blue Wave 3.
Position: Gray Wave 3.
Next lower degree direction: Micro Navy Blue Wave 4.
Details: Micro navy blue wave 2 of 3 appears complete; micro navy blue wave 3 of 3 is now active.
Wave cancel level: 1,367.95.
S&P/TSX 60 day chart analysis summary
The S&P/TSX 60 Day Chart Elliott Wave analysis indicates a bullish trend within an impulsive wave structure, focused on the progression of micro navy blue wave 3. Currently positioned within gray wave 3, this wave reflects a bullish advance, gaining momentum as it moves through the impulsive phase. Micro navy blue wave 2 of 3 has concluded, signaling the market's entry into micro navy blue wave 3 of 3, an intensified phase of the broader upward trend.
The shift from micro navy blue wave 2 to wave 3 suggests strengthening buying pressure, typical for the third wave in an impulsive Elliott Wave pattern. This wave often experiences increased volume and accelerated price movement, supporting the bullish outlook for the S&P/TSX 60 index at this stage.
Looking ahead, the market is expected to progress toward micro navy blue wave 4, where a brief corrective pullback may occur upon completion of the current impulsive wave. This aligns with Elliott Wave principles, where markets alternate between impulsive and corrective waves. After completing micro navy blue wave 3, wave 4 would introduce a short consolidation or minor retracement before potentially continuing the bullish trend.
The wave cancellation level is set at 1,367.95. A price drop below this threshold would invalidate the current wave count, suggesting a need for a reassessment of the directional trend and wave structure.
Summary of S&P/TSX 60 day chart outlook
In summary, the S&P/TSX 60 is in a bullish trend within an impulsive wave structure, currently advancing through micro navy blue wave 3 of 3. This phase indicates a strong upward movement, with the possibility of a minor correction in wave 4. This wave structure remains intact unless prices fall below the 1,367.95 cancellation level.
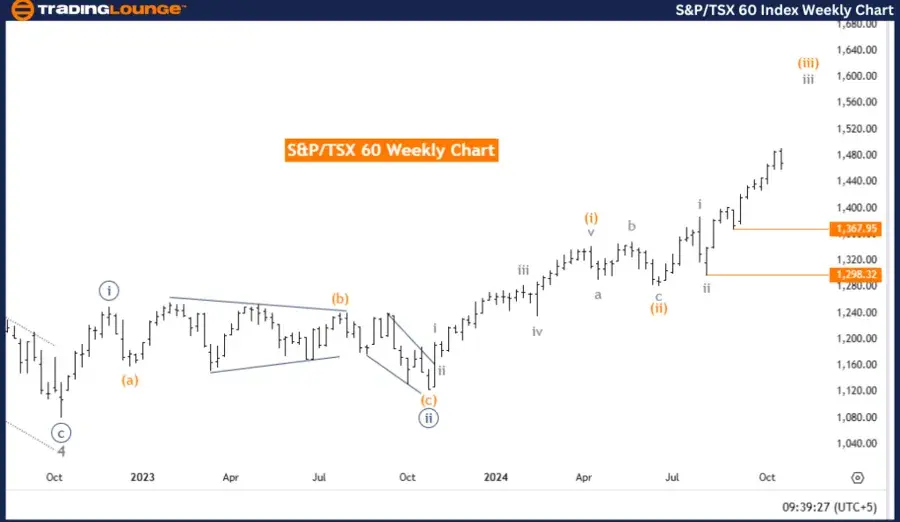
S&P/TSX 60 Elliott Wave Analysis - Trading Lounge Weekly Chart.
Instrument: S&P/TSX 60 - Weekly Chart.
Analysis type: Elliott Wave technical analysis
Function: Bullish Trend.
Mode: Impulsive.
Wave structure: Gray Wave 3.
Position: Orange Wave 3.
Next lower degree direction: Gray Wave 4.
Details: Gray wave 2 of 3 is complete; gray wave 3 of 3 is now active.
Wave cancel level: 1,298.32.
S&P/TSX 60 weekly chart analysis summary
The S&P/TSX 60 Weekly Chart Elliott Wave analysis points to a bullish trend within an impulsive wave structure, focusing on the progression of gray wave 3. Currently situated in orange wave 3, this wave suggests a steady upward movement as it advances through the impulsive phase of gray wave 3. The completion of gray wave 2 of 3 indicates the market is now transitioning into gray wave 3 of 3, typically a period of strong buying activity and notable upward momentum according to Elliott Wave principles.
The shift from gray wave 2 to gray wave 3 reflects a reinforced bullish sentiment, a common feature of the third wave in an impulsive Elliott Wave pattern. This phase often brings increased price momentum and trading volume, underscoring the strength of the ongoing bullish trend. With gray wave 3 in progress, further upward potential is suggested before any major retracement occurs.
Upon the completion of gray wave 3, the next anticipated phase is gray wave 4, which aligns with a corrective pullback within the Elliott Wave cycle. This cycle alternates between impulsive and corrective phases, suggesting that a minor retracement might follow gray wave 3, allowing the market to consolidate before possibly resuming its upward trend.
The wave cancellation level is set at 1,298.32. If prices fall below this threshold, the current wave count would be invalidated, necessitating a reassessment of the bullish outlook and wave structure.
Summary of S&P/TSX 60 weekly chart outlook
In conclusion, the S&P/TSX 60 index is currently in a bullish trend within an impulsive structure, advancing through gray wave 3 of 3. This phase is associated with robust upward movement, with the current wave structure remaining valid unless prices dip below the 1,298.32 cancellation level.
Technical analysis: Malik Awais.
Analysis type: Elliott Wave technical analysis [Video]
Author

Peter Mathers
TradingLounge
Peter Mathers started actively trading in 1982. He began his career at Hoei and Shoin, a Japanese futures trading company.


