S&P/TSX 60 Elliott Wave technical analysis [Video]
![S&P/TSX 60 Elliott Wave technical analysis [Video]](https://editorial.fxstreet.com/images/Markets/Equities/Industries/CommunicationServices/mobile-phone-637435389695511071_XtraLarge.jpg)
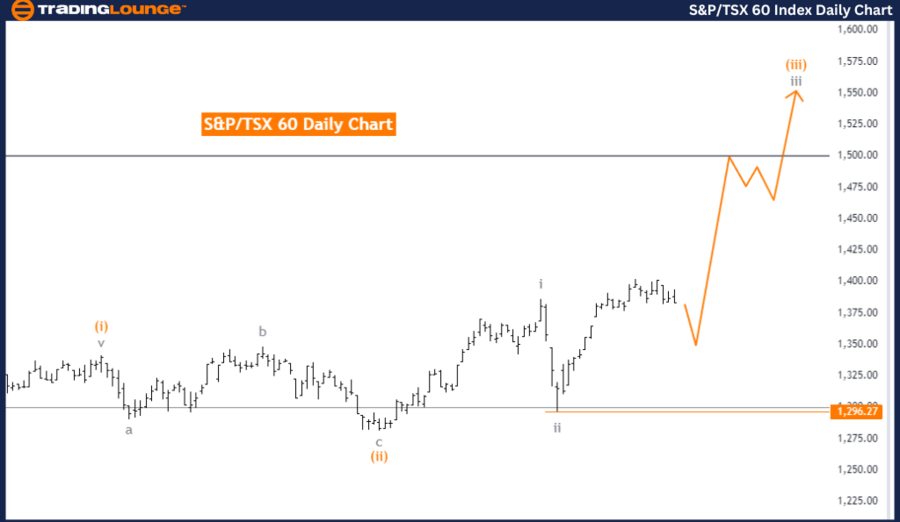
S&P/TSX 60 Elliott Wave Analysis Trading Lounge Day Chart.
S&P/TSX 60 Elliott Wave technical analysis
Function: Bullish Trend.
Mode: Impulsive.
Structure: Gray Wave 3.
Position: Orange Wave 3.
Direction next higher degrees: Gray Wave 3 (Continue).
Details: Gray wave 2 of orange wave 3 appears completed. Now, gray wave 3 of 3 is in progress. The wave cancellation invalidation level is set at 1,296.27.
The S&P/TSX 60 daily chart is currently reflecting a bullish trend based on the Elliott Wave technical analysis. The trend is in an impulsive mode, which points to strong upward momentum in the market. The main structure under observation is gray wave 3, with the current market position falling under orange wave 3 within the overall wave sequence.
It seems that gray wave 2 of orange wave 3 has been completed, and the market is now progressing into gray wave 3 of orange wave 3. This signals that the market continues its upward trajectory, with further gains anticipated as the bullish trend advances. The focus remains on the continuation of gray wave 3, indicating sustained bullish momentum in the short term.
A key component of the analysis is the wave cancel invalidation level, set at 1,296.27. This level is crucial for traders to monitor. If the market price reaches or drops below this point, the current Elliott Wave analysis would be considered invalid, and a new market analysis would be required.
In summary, the S&P/TSX 60 chart presents a bullish, impulsive trend, with gray wave 3 and orange wave 3 actively unfolding. Gray wave 2 has been completed, and the chart is now reflecting progress into gray wave 3 of 3. The invalidation level of 1,296.27 is a critical point, as any drop below this level would invalidate the current wave count and prompt a reevaluation of the market’s direction.
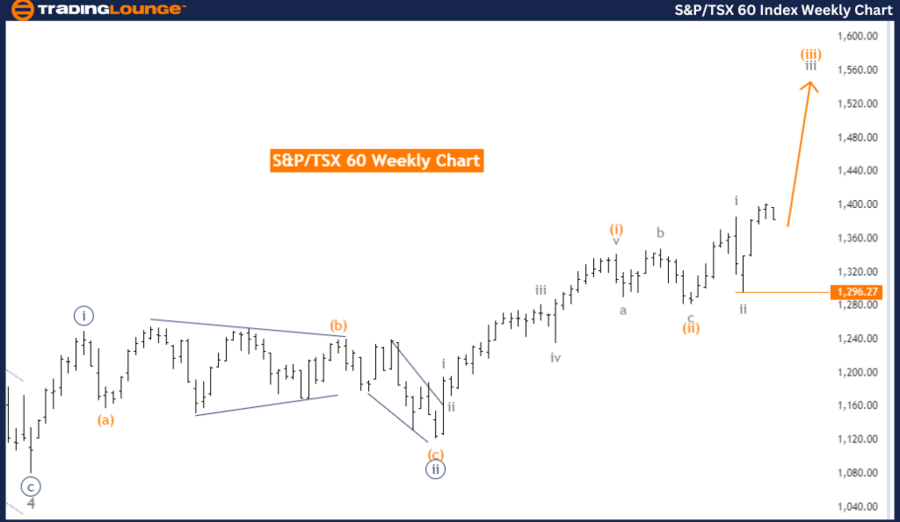
S&P/TSX 60 Elliott Wave Analysis Trading Lounge Weekly Chart.
S&P/TSX 60 Elliott Wave technical analysis
Function: Bullish Trend.
Mode: Impulsive.
Structure: Gray Wave 3.
Position: Orange Wave 3.
Direction next higher degrees: Gray Wave 3 (Continue).
Details: Gray wave 2 of orange wave 3 appears completed, and now gray wave 3 of 3 is in progress. The wave cancellation invalidation level is set at 1,296.27.
The S&P/TSX 60 weekly chart shows a bullish trend based on Elliott Wave analysis. The market is currently in an impulsive mode, indicating strong upward momentum driving the price action. The main wave structure under observation is gray wave 3, with the current position identified as orange wave 3. This wave count suggests that the market is advancing through a series of upward movements as part of the larger bullish trend.
The analysis points out that gray wave 2 of orange wave 3 has been completed, and the market has now moved into gray wave 3 of 3. This continues the existing bullish momentum, with further upward movement expected as the market progresses through the next stages of the wave sequence. The higher degree trends indicate that gray wave 3 is likely to continue, suggesting that the market’s upward movement is expected to persist in the medium term.
The wave cancel invalidation level for this Elliott Wave count is set at 1,296.27. This is a key level for traders to monitor closely. If the price falls below this point, the current wave analysis would be invalidated, implying that the market might change direction, or a new wave structure may need to be reassessed.
In summary, the S&P/TSX 60 weekly chart presents a bullish outlook, with the market in an impulsive upward trend. Gray wave 2 has been completed, and gray wave 3 of orange wave 3 is now in play, indicating potential further gains. The wave cancel invalidation level of 1,296.27 is a critical point to watch, as a breach of this level would invalidate the current wave count, leading to a reevaluation of the market’s direction.
Technical analyst: Malik Awais.
S&P/TSX 60 Elliott Wave Technical Analysis [Video]
Author

Peter Mathers
TradingLounge
Peter Mathers started actively trading in 1982. He began his career at Hoei and Shoin, a Japanese futures trading company.


