S&P BSE Sensex (INDIA) Index Elliott Wave technical analysis [Video]
![S&P BSE Sensex (INDIA) Index Elliott Wave technical analysis [Video]](https://editorial.fxstreet.com/images/Markets/Equities/Industries/ConsumerServices/woman-consumer-office-637435344173237349_XtraLarge.jpg)
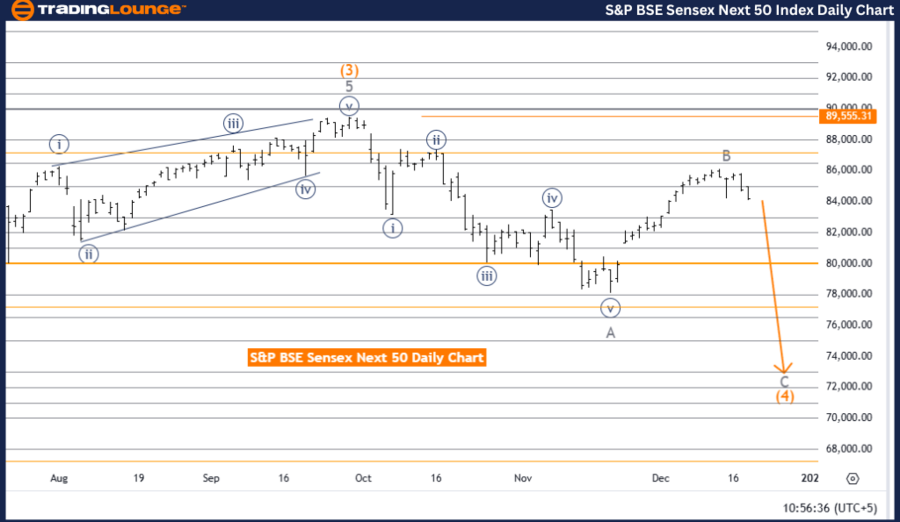
S&P BSE Sensex (INDIA) Elliott Wave Analysis Trading Lounge Day Chart.
S&P BSE Sensex (INDIA) Elliott Wave technical analysis
-
Function: Counter Trend.
-
Mode: Impulsive.
-
Structure: Gray Wave C.
-
Position: Orange Wave 4.
-
Direction next higher degrees: Orange Wave 5.
-
Details: Gray wave B of orange wave 4 is considered complete. Currently, gray wave C of orange wave 4 is in progress.
-
Wave cancel invalid level: 89,555.31.
The S&P BSE Sensex daily chart analysis indicates a counter-trend movement following Elliott Wave principles. The ongoing wave structure is impulsive, with gray wave C actively developing. This progression marks a continuation of the corrective phase within the broader trend.
-
Gray wave B of orange wave 4 has been completed, signifying the conclusion of the prior corrective phase.
-
The market has transitioned into gray wave C of orange wave 4, indicating a critical phase in the correction that is expected to advance further, potentially finalizing the corrective pattern.
The market’s positioning within orange wave 4 suggests that upon the completion of gray wave C, the focus will shift to orange wave 5, marking a return to the dominant trend after the corrective phase. This cyclical progression highlights the natural flow of wave movements within the Elliott Wave framework.
The wave cancel invalid level is set at 89,555.31. A rise above this level would invalidate the current Elliott Wave count for gray wave C of orange wave 4, necessitating a re-evaluation of the analysis. This level serves as a crucial benchmark for monitoring the validity of the analysis and managing risk.
Summary
The S&P BSE Sensex daily chart analysis reveals a counter-trend phase characterized by:
-
The completion of gray wave B.
-
The active development of gray wave C within orange wave 4.
This corrective movement indicates a temporary deviation from the dominant trend, with a potential shift back to the primary wave structure in orange wave 5. The invalidation level at 89,555.31 serves as a critical reference for observing changes in market dynamics.
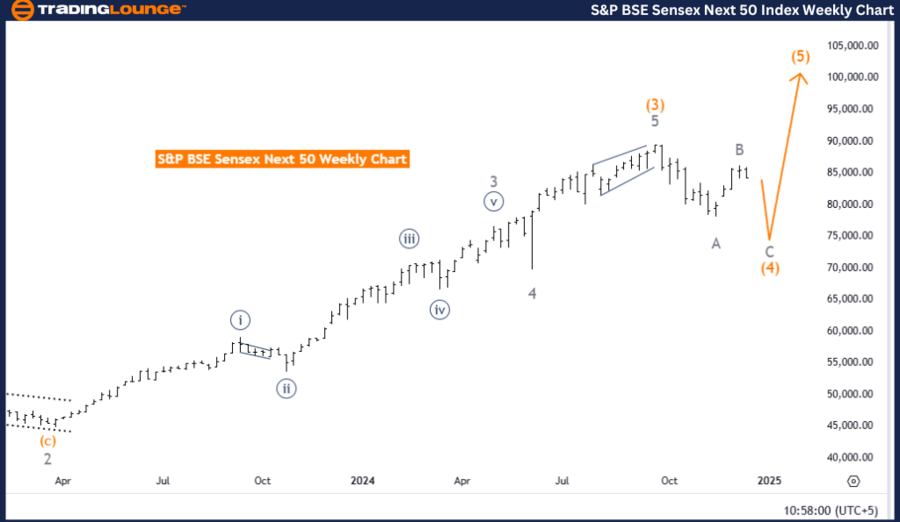
S&P BSE Sensex (INDIA) Elliott Wave Analysis Trading Lounge Weekly Chart
S&P BSE Sensex (INDIA) Elliott Wave technical analysis
-
Function: Counter Trend.
-
Mode: Impulsive.
-
Structure: Gray Wave C.
-
Position: Orange Wave 4.
-
Direction next higher degrees: Orange Wave 5.
-
Details: Gray wave B of orange wave 4 is complete. Currently, gray wave C of orange wave 4 is in progress.
The weekly analysis of the S&P BSE Sensex focuses on a counter-trend movement based on the Elliott Wave framework. The ongoing wave structure is impulsive, with gray wave C actively developing as part of a corrective phase moving against the prevailing trend.
-
Gray wave B of orange wave 4 has concluded, signaling the end of the prior corrective sub-wave.
-
The market has transitioned into gray wave C of orange wave 4, continuing the corrective structure. This wave is expected to further develop before reaching its final stage.
The market's position within orange wave 4 indicates that this corrective phase is approaching its conclusion. Upon the completion of gray wave C, the market is expected to shift into orange wave 5, resuming alignment with the broader trend and returning to the primary wave sequence.
This analysis highlights the cyclical nature of market behavior, where corrective waves temporarily deviate before the resumption of dominant trends. The active gray wave C of orange wave 4 reflects this principle, providing insights into the current market phase.
Summary
The S&P BSE Sensex weekly chart analysis illustrates a counter-trend phase, characterized by:
-
The completion of gray wave B.
-
The active development of gray wave C within orange wave 4.
This corrective wave sequence is expected to conclude before transitioning into orange wave 5, marking a return to the dominant trend. The analysis offers a comprehensive understanding of the corrective wave structure within the larger Elliott Wave pattern.
Technical analyst: Malik Awais.
S&P BSE Sensex (INDIA) Elliott Wave technical analysis [Video]
Author

Peter Mathers
TradingLounge
Peter Mathers started actively trading in 1982. He began his career at Hoei and Shoin, a Japanese futures trading company.


