S&P BSE Sensex (India) Elliott Wave technical analysis [Video]
![S&P BSE Sensex (India) Elliott Wave technical analysis [Video]](https://editorial.fxstreet.com/images/i/bullish-line_XtraLarge.png)
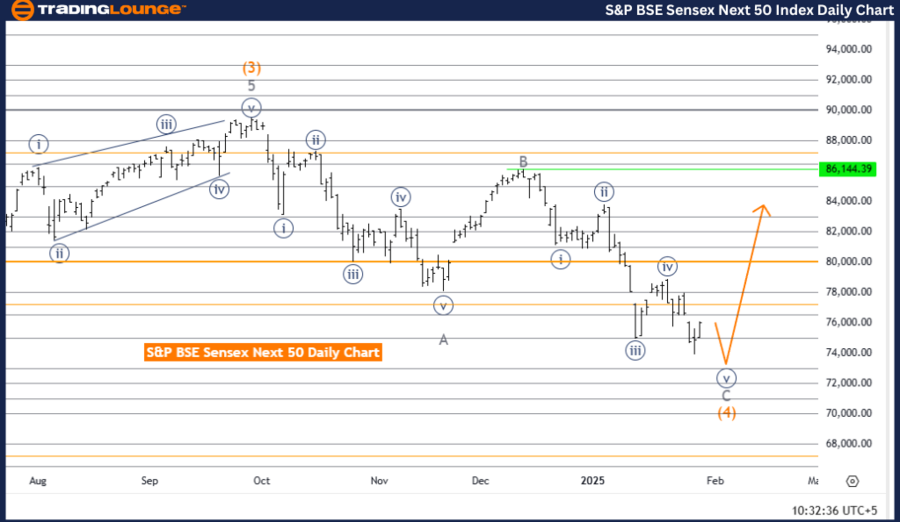
S&P BSE Sensex (INDIA) Elliott Wave Analysis – Trading Lounge Day Chart
S&P BSE Sensex (India) Elliott Wave technical analysis
Function: Counter Trend.
Mode: Impulsive.
Structure: Gray Wave C.
Position: Orange Wave 4.
Direction Next Higher Degrees: Orange Wave 5.
Details: Gray Wave B of 4 appears completed, with Gray Wave C of 4 now in play.
Analysis overview
This analysis evaluates the S&P BSE Sensex (India) Index using Elliott Wave Theory on a daily chart, highlighting a counter-trend movement with an impulsive mode. The primary structure under observation is Gray Wave C, which has begun following the completion of Gray Wave B within Orange Wave 4. This development indicates the continuation of a corrective phase within the broader market trend.
At present, the market is positioned in Orange Wave 4, with Gray Wave C actively in progress. This phase signifies the continuation of the corrective process, following the conclusion of Gray Wave B. The emergence of Gray Wave C suggests further movement within Orange Wave 4, before the anticipated development of Orange Wave 5, which is expected to push the market back into a bullish trend.
Key considerations
The completion of Gray Wave C is crucial to confirming the transition to Orange Wave 5.
Traders should closely monitor this corrective phase, as it provides key insights into market consolidation and potential upcoming movements.
The expected development of Orange Wave 5 signals a likely return to bullish momentum following the resolution of the current corrective structure.
Conclusion
The daily chart analysis for S&P BSE Sensex identifies a corrective counter-trend phase, driven by the formation of Gray Wave C within Orange Wave 4. The completion of Gray Wave B marks the transition into this ongoing corrective phase.
The anticipated emergence of Orange Wave 5 suggests the potential for a return to upward momentum, once the current corrective structure resolves.
This Elliott Wave analysis offers valuable guidance for traders, equipping them with the necessary insights to navigate the market's temporary pullback, while preparing for potential future upward movement. Tracking key developments within the Elliott Wave framework will be essential in confirming the next market direction.
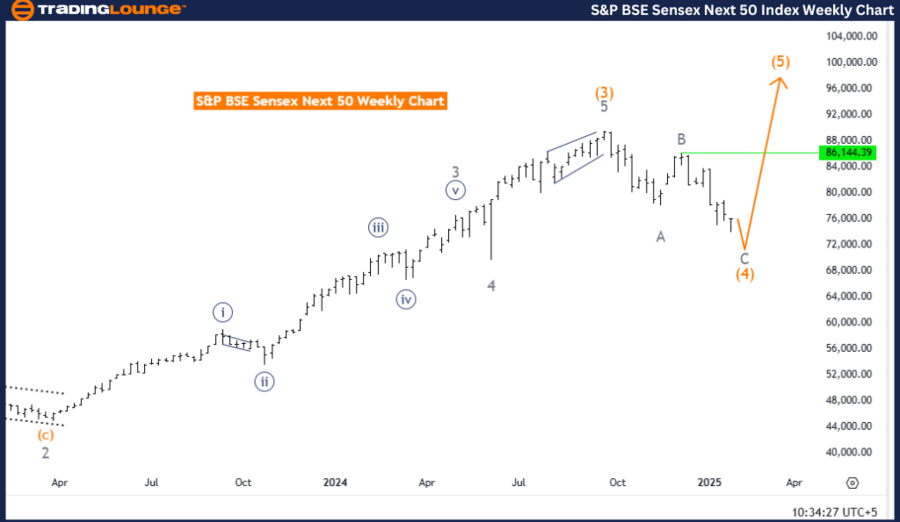
S&P BSE Sensex (INDIA) Elliott Wave Analysis – Trading Lounge Weekly Chart
S&P BSE Sensex (India) Elliott Wave technical analysis
Function: Counter Trend.
Mode: Corrective.
Structure: Orange Wave 4.
Position: Navy Blue Wave 1.
Direction Next Higher Degrees: Orange Wave 5.
Details: Orange Wave 3 appears completed, and Orange Wave 4 is currently in play, nearing its conclusion.
Analysis overview
This analysis examines the S&P BSE Sensex (India) Index using Elliott Wave Theory on a weekly chart, identifying a counter-trend phase with a corrective mode. The primary structure under observation is Orange Wave 4, which has commenced following the completion of Orange Wave 3. This suggests that the market is currently experiencing a temporary corrective phase.
The index is positioned within Navy Blue Wave 1, indicating that the market remains in a structured phase as part of Orange Wave 4. This corrective wave appears to be nearing its conclusion, signaling a potential shift back to bullish momentum once Orange Wave 5 begins.
The completion of Orange Wave 4 is critical for confirming the market's readiness for the next impulsive phase.
Key considerations
Monitoring the completion of Orange Wave 4 is essential, as it will serve as a major turning point in the market structure.
The anticipated transition to Orange Wave 5 is expected to resume the broader upward trend, creating new trading opportunities.
Traders should remain attentive to key developments within the Elliott Wave structure, as they provide insights into potential future market movements.
Conclusion
The weekly chart analysis for S&P BSE Sensex highlights a corrective counter-trend phase, driven by Orange Wave 4. The completion of Orange Wave 3 and the impending conclusion of Orange Wave 4 suggest that the market may soon shift back to a bullish phase with the emergence of Orange Wave 5.
This Elliott Wave analysis offers essential insights for traders, helping them anticipate potential market shifts and align their strategies accordingly. By closely monitoring the ongoing wave structure, traders can prepare for future opportunities within the evolving market trend.
S&P BSE Sensex (India) Elliott Wave technical analysis [Video]
Author

Peter Mathers
TradingLounge
Peter Mathers started actively trading in 1982. He began his career at Hoei and Shoin, a Japanese futures trading company.


