S&P BSE Sensex (India) Elliott Wave technical analysis [Video]
![S&P BSE Sensex (India) Elliott Wave technical analysis [Video]](https://editorial.fxsstatic.com/images/i/Equity-Index_S&P500-2_XtraLarge.jpg)
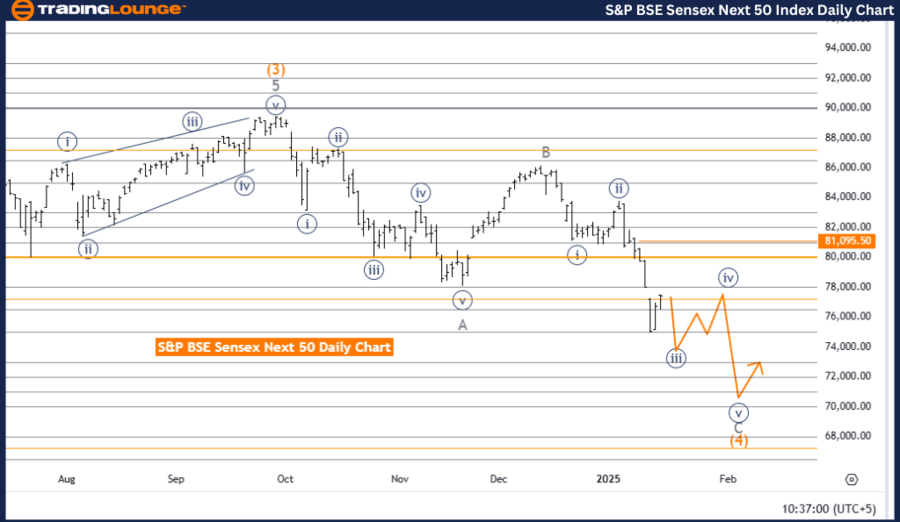
S&P BSE Sensex (India) Elliott Wave Analysis Trading Lounge Day Chart.
S&P BSE Sensex (India) Wave technical analysis
Key analysis details
-
Function: Counter Trend.
-
Mode: Impulsive.
-
Structure: Gray Wave C.
-
Position: Orange Wave 4.
-
Direction (next higher degrees): Orange Wave 5.
-
Details: Gray wave B of orange wave 4 appears completed; gray wave C of orange wave 4 is now active.
-
Wave cancel invalidation level: 81,095.50.
The S&P BSE Sensex is currently in a counter-trend phase, as identified by Elliott Wave Analysis on the daily chart. The market is displaying impulsive behavior, represented by gray wave C, which forms part of the broader orange wave four structure. This phase reflects a continuation of the corrective trend within the larger cycle.
Gray wave B of orange wave four seems to have concluded, and the market is now progressing through gray wave C of orange wave four. This wave is critical as it defines the final corrective leg before an expected transition to orange wave five, which is projected to resume the larger bullish trend.
The invalidation level for this wave structure is set at 81,095.50. A price movement below this level would invalidate the current wave scenario, requiring a reevaluation of the market's technical outlook. This level is a vital benchmark for confirming the corrective structure and ensuring the integrity of the Elliott Wave framework.
Summary
-
Counter Trend: The S&P BSE Sensex is in a corrective phase.
-
Current Phase: Gray wave C of orange wave four is actively unfolding, following the completion of gray wave B.
-
Impulsive Behavior: Gray wave C marks the final leg of the current corrective trend.
-
Next Step: Anticipated upward movement in orange wave five to resume the bullish cycle.
-
Invalidation Level: 81,095.50 serves as a critical reference point for monitoring the wave’s progression and confirming the analysis.
The focus remains on the completion of the current corrective structure and the anticipated transition to the next bullish phase.
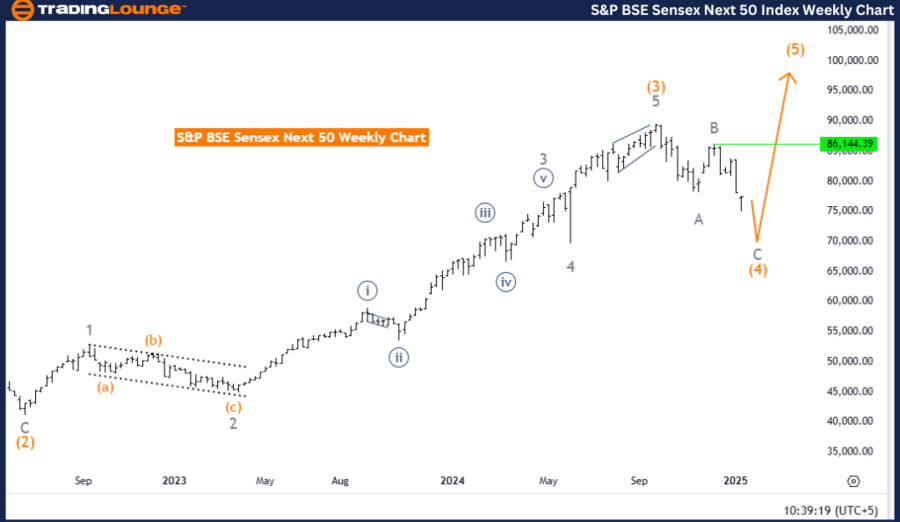
S&P BSE Sensex (India) Elliott Wave Analysis Trading Lounge weekly chart
S&P BSE Sensex (India) Elliott Wave technical analysis
Key analysis details
-
Function: Counter Trend.
-
Mode: Corrective.
-
Structure: Gray Wave C.
-
Position: Orange Wave 4.
-
Direction (next higher degrees): Orange Wave 5.
-
Details: Gray wave B of orange wave 4 appears completed; gray wave C of orange wave 4 is now active.
The S&P BSE Sensex is presently in a counter-trend phase, as highlighted by Elliott Wave Analysis on the weekly chart. The market is in a corrective mode, represented by gray wave C, which is part of the broader orange wave four structure. This phase indicates a continuation of the correction within the larger wave cycle.
Gray wave B of orange wave four is considered completed, and the market is now advancing through gray wave C of orange wave four. This wave constitutes the final corrective leg of the structure, setting the stage for a transition to orange wave five, which is expected to resume the larger bullish trend.
The progression of gray wave C is crucial to finalizing the corrective phase represented by orange wave four. Once gray wave C concludes, the market is anticipated to shift toward orange wave five, initiating a new upward movement aligned with the higher-degree bullish trend.
Summary
-
Counter Trend: The S&P BSE Sensex is undergoing a corrective phase.
-
Current Phase: Gray wave C of orange wave four is actively developing, marking the final phase of the correction.
-
Next Step: Transition to orange wave five is anticipated, resuming the larger bullish cycle.
-
Importance of Gray Wave Critical in completing the current counter-trend structure and maintaining alignment with the broader wave framework.
The analysis underscores the significance of gray wave C in completing the ongoing corrective structure while preparing the market for a potential bullish move in the next phase, orange wave five.
S&P BSE Sensex (India) Elliott Wave technical analysis [Video]
Author

Peter Mathers
TradingLounge
Peter Mathers started actively trading in 1982. He began his career at Hoei and Shoin, a Japanese futures trading company.


