S&P BSE Sensex (India) Elliott Wave technical analysis [Video]
![S&P BSE Sensex (India) Elliott Wave technical analysis [Video]](https://editorial.fxstreet.com/images/Markets/Equities/Industries/EnergyStocks/water-dam-637435385737031716_XtraLarge.jpg)
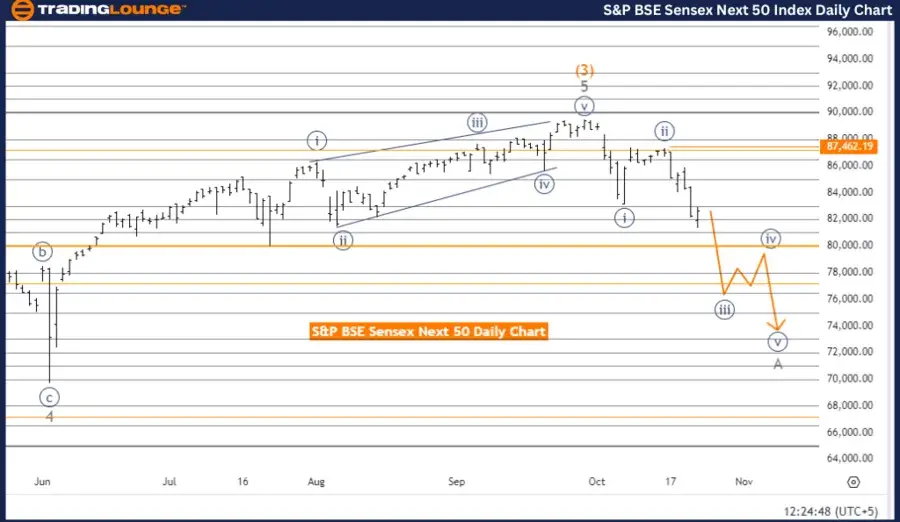
S&P BSE Sensex (India) Elliott Wave Analysis Trading Lounge Day Chart.
S&P BSE Sensex (India) Elliott Wave technical analysis
-
Function: Counter Trend.
-
Mode: Impulsive.
-
Structure: Navy Blue Wave 3.
-
Position: Gray wave A.
-
Direction next higher degrees: Navy blue wave 4.
Details:
Navy blue wave 2 appears completed, and now navy blue wave 3 is in progress. The wave cancel invalidation level is set at 81,462.19.
The S&P BSE Sensex Elliott Wave analysis on the daily chart highlights a counter-trend movement with an impulsive mode. The current wave structure is navy blue wave 3, with gray wave A forming part of this structure. This indicates that the market is experiencing a strong downward movement within the broader corrective phase of navy blue wave 3.
The analysis suggests that navy blue wave 2 has completed, and navy blue wave 3 is actively unfolding. This typically marks a significant impulsive downward move within the overall corrective pattern, signaling a shift toward a more bearish market sentiment.
The focus is on gray wave A within navy blue wave 3, which is the initial part of the wave structure, with further movement expected as this cycle progresses. Once gray wave A concludes, the next wave within the sequence will continue, progressing within navy blue wave 3, suggesting ongoing downward momentum for the market.
The next higher degree wave, navy blue wave 4, is the stage to monitor, but it is not yet in play. For now, navy blue wave 3 dominates the trend. Traders should closely observe market behavior as gray wave A unfolds and approaches completion.
The invalidation level for the current wave structure is 81,462.19. If the market breaches this level, the current wave count would be invalidated, requiring a reassessment of the Elliott Wave structure.
In summary, the S&P BSE Sensex daily chart indicates that navy blue wave 3 is progressing after the completion of navy blue wave 2. The market is expected to continue its downward impulsive movement within gray wave A. The invalidation level is 81,462.19.
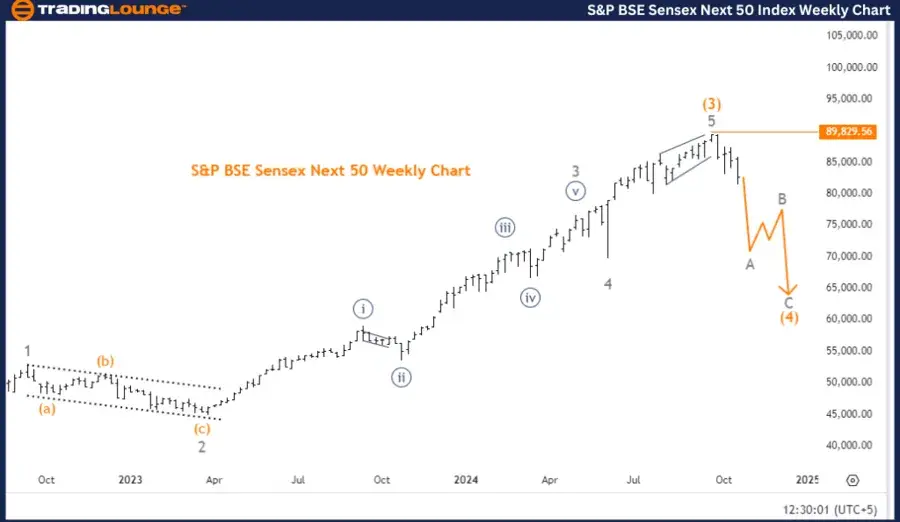
S&P BSE Sensex (India) Elliott Wave Analysis Trading Lounge Weekly Chart
S&P BSE Sensex (India) Elliott Wave technical analysis
-
Function: Counter Trend.
-
Mode: Corrective.
-
Structure: Gray wave A.
-
Position: Orange Wave 4.
-
Direction next higher degrees: Gray wave B.
Details:
Orange wave 3 appears completed, and now wave A of orange wave 4 is in progress. The wave cancel invalidation level is set at 89,829.56.
The S&P BSE Sensex weekly Elliott Wave analysis identifies the current market movement as part of a counter-trend correction. The mode is corrective, meaning the market is retracing within the broader upward trend. The structure being analyzed is gray wave A, currently unfolding within orange wave 4, which is progressing through its sub-waves.
The analysis suggests that orange wave 3, part of a higher wave degree, has concluded. Now, wave A of orange wave 4 is actively unfolding, marking a pause or temporary reversal within the larger bullish trend. Once wave A of orange wave 4 completes, the market is expected to transition into the next phases of this corrective pattern, eventually leading to gray wave B.
The completion of orange wave 3 indicates a shift from the previous trend, with the market now consolidating or correcting. This type of consolidation is typical within corrective structures, where the market pauses to absorb previous gains before advancing further.
The next significant phase to monitor is gray wave B, which represents the next higher-degree wave that will develop following the current corrective phase. Gray wave B is expected to lead the market into its next significant movement in the Elliott Wave structure.
The wave cancellation invalidation level is set at 89,829.56. If the market breaches this level, the current wave count will be invalidated, requiring a reassessment of the structure.
In summary, the weekly analysis indicates that the market is in a corrective phase, with gray wave A currently in progress. Orange wave 4 is unfolding, and the market is expected to continue within this corrective movement. The invalidation level is 89,829.56.
Technical analyst: Malik Awais.
S&P BSE Sensex (India) Elliott Wave technical analysis [Video]
Author

Peter Mathers
TradingLounge
Peter Mathers started actively trading in 1982. He began his career at Hoei and Shoin, a Japanese futures trading company.