S&P/ASX 200 Index Elliott Wave technical analysis [Video]
![S&P/ASX 200 Index Elliott Wave technical analysis [Video]](https://editorial.fxstreet.com/images/Markets/Equities/SP500/wall-street-sign-637299022550250958_XtraLarge.jpg)
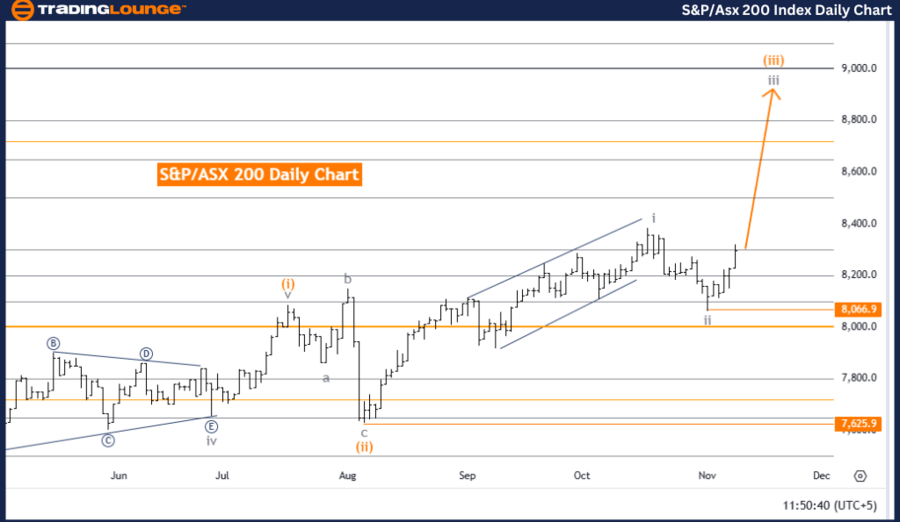
S&P/ASX 200 Elliott Wave Analysis Trading Lounge day chart.
S&P/ASX 200 Elliott Wave technical analysis
-
Function: Bullish Trend.
-
Mode: Impulsive.
-
Structure: Gray Wave 3.
-
Position: Orange Wave 3.
-
Direction next higher degrees: Gray Wave 3 (initiated).
-
Details: Gray Wave 2 appears completed, with Gray Wave 3 now in progress.
-
Wave cancel invalid level: 7,066.9.
The S&P/ASX 200 Day Chart Elliott Wave analysis points to a bullish trend forming in an impulsive mode, currently unfolding in Gray Wave 3. After what appears to be the completion of Gray Wave 2, the chart now shows Gray Wave 3 underway, signaling a continuation of the upward trend.
In Elliott Wave theory, Wave 3 typically represents the most forceful and dynamic phase in an impulsive sequence, often characterized by robust upward movement. This analysis aligns with a sustained bullish outlook, reflecting growing market momentum.
Positioned within Orange Wave 3 of Gray Wave 3, the structure supports further upward potential, suggesting that this phase is part of a larger trend cycle aiming for higher levels. Orange Wave 3 reinforces the impulsive nature of Gray Wave 3, generally viewed as a phase of accelerating price movement within the broader bullish context. This wave pattern indicates that any short-term corrective dips are likely to remain shallow, given the prevailing strength of the current phase.
The invalidation level is set at 7,066.9, marking a critical threshold for maintaining the bullish scenario. If prices dip below this level, the current wave structure would be invalidated, necessitating a reassessment of the wave count. Until then, the analysis anticipates ongoing upward momentum in Gray Wave 3, in line with the bullish trend direction of the higher degrees.
In summary
The S&P/ASX 200 Day Chart analysis reveals a strong bullish trend in an impulsive phase within Gray Wave 3, following the completion of Gray Wave 2. Positioned in Orange Wave 3, the market shows significant upward potential with minimal corrections, consistent with the expected strength of a Wave 3 impulse. The invalidation level of 7,066.9 acts as a critical boundary, reinforcing the wave count and supporting expectations for continued upward movement.
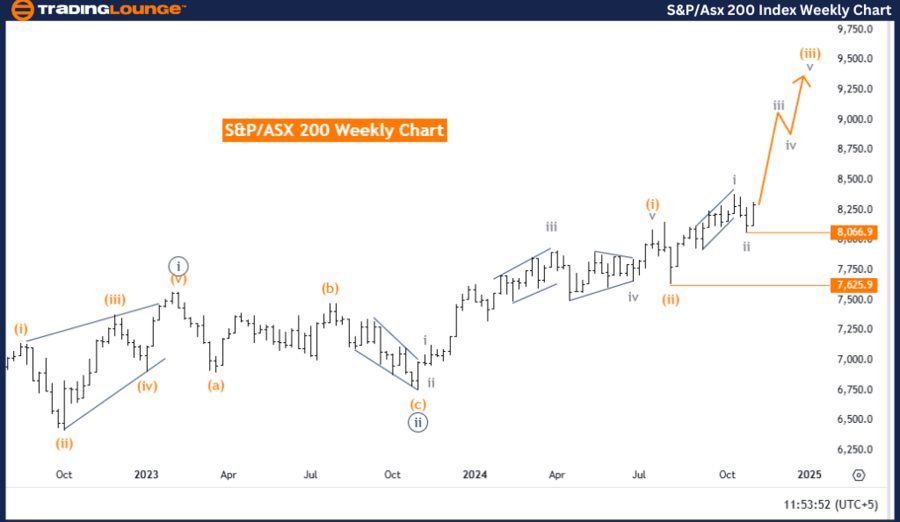
S&P/ASX 200 Elliott Wave Analysis Trading Lounge weekly chart
S&P/ASX 200 Elliott Wave technical analysis
-
Function: Bullish Trend.
-
Mode: Impulsive.
-
Structure: Gray Wave 3.
-
Position: Orange Wave 3.
-
Direction next higher degrees: Gray Wave 3 (initiated).
-
Details: Gray Wave 2 appears completed, with Gray Wave 3 now active.
-
Wave cancel invalid level: 7,066.9.
The S&P/ASX 200 Weekly Chart Elliott Wave analysis indicates a bullish trend progressing in an impulsive mode, with Gray Wave 3 currently advancing. Following the apparent completion of Gray Wave 2, the structure now points to Gray Wave 3 in motion, signaling strong upward momentum. According to Elliott Wave principles, Wave 3 typically represents a powerful phase in the trend, marked by robust price action and directional strength.
Situated within Orange Wave 3 of Gray Wave 3, this move contributes to a larger bullish cycle, further reinforcing a positive outlook. Orange Wave 3 often indicates heightened buying interest within the impulsive sequence, frequently leading to new highs as the trend develops. This wave structure implies that any pullbacks will likely remain minor and temporary, as the overall trend leans toward continued upward movement.
The wave cancellation or invalidation level is established at 7,066.9, acting as a critical reference for maintaining the bullish projection. If prices fall below this level, the existing wave count would be invalidated, necessitating a reassessment of the current wave position. However, provided this invalidation threshold holds, the chart supports sustained bullish momentum within the larger impulsive framework of Gray Wave 3, with further gains expected.
In summary
The S&P/ASX 200 Weekly Chart analysis reflects a strong bullish outlook as Gray Wave 3 progresses in its impulsive phase. Orange Wave 3 within this larger wave structure supports continued upward movement, indicating a strong trend continuation. The invalidation level at 7,066.9 serves as a critical boundary to confirm the wave count, with a stable bullish bias as long as prices remain above this threshold. The current wave sequence suggests potential for further gains.
S&P/ASX 200 Index Elliott Wave technical analysis [Video]
Author

Peter Mathers
TradingLounge
Peter Mathers started actively trading in 1982. He began his career at Hoei and Shoin, a Japanese futures trading company.


