S&P/ASX 200 Index Elliott Wave technical analysis [Video]
![S&P/ASX 200 Index Elliott Wave technical analysis [Video]](https://editorial.fxstreet.com/images/Markets/Equities/SP500/wall_street_nyse4-637299025173341169_XtraLarge.jpg)
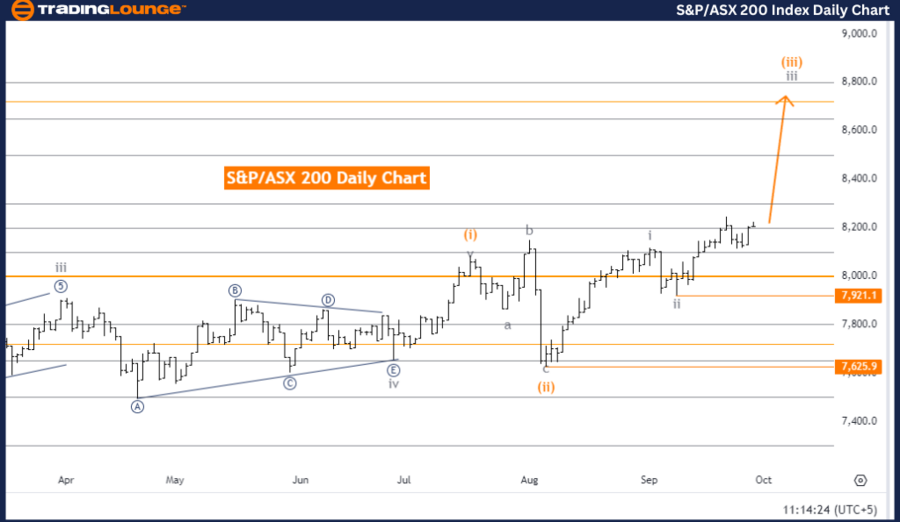
S&P/ASX 200 Elliott Wave Analysis Trading Lounge Day Chart.
S&P/ASX 200 Elliott Wave technical analysis
Function: Bullish Trend
Mode: Impulsive
Strucutre: Gray Wave 3
Position: Orange Wave 3
Direction next lower degrees: Gray Wave 4
Details: Gray wave 2 appears complete. Now gray wave 3 of orange wave 3 is in progress. Wave cancel invalidation level: 7,921.1.
The S&P/ASX 200 Elliott Wave Analysis for the Day Chart suggests a bullish trend, indicating an upward movement in the market. The mode of this trend is impulsive, representing a strong and dynamic movement aligned with the trend.
The structure currently analyzed is labeled as gray wave 3, under the Elliott Wave Theory framework.
Regarding positioning, the market is within orange wave 3, indicating the broader impulsive trend is still ongoing. The next anticipated movement would be gray wave 4, typically marking a corrective phase after gray wave 3. However, gray wave 3 is still active, showing that the market's upward movement continues.
The previous phase, gray wave 2, is considered complete, which sets up the gray wave 3 of orange wave 3 currently underway. In Elliott Wave terms, wave 3 is often the strongest and longest in a five-wave sequence, indicating strong bullish momentum propelling the market upward.
There is a critical invalidation level at 7,921.1. If the market drops below this point, the current wave analysis would be deemed invalid, requiring a reassessment of the wave structure. This level is crucial for traders to monitor since staying above it supports the bullish outlook.
Overall, the analysis indicates the bullish trend remains intact with further upside potential, though traders should be mindful of the invalidation level. The completion of gray wave 3 is expected before a significant correction, likely in the form of gray wave 4, occurs.
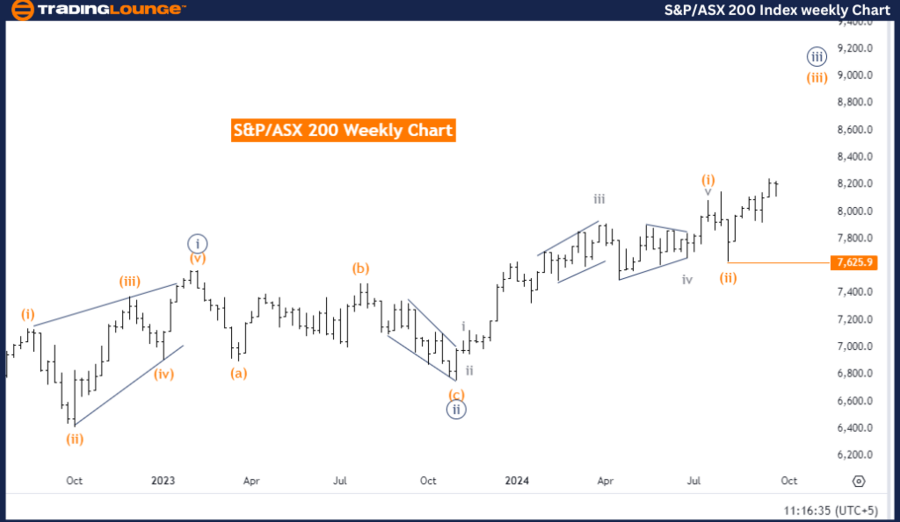
S&P/ASX 200 Elliott Wave Analysis Trading Lounge Weekly Chart
S&P/ASX 200 Elliott Wave technical analysis
Function: Bullish Trend.
Mode: Impulsive.
Structure: Orange Wave 3.
Position: Navy Blue Wave 3.
Direction next lower degrees: Orange Wave 4.
Details: Orange wave 2 appears complete. Now orange wave 3 of 3 is in progress. Wave cancel invalidation level: 7,625.9.
The S&P/ASX 200 Elliott Wave Analysis for the Weekly Chart highlights a bullish trend, indicating that the market is moving upward. The trend mode is impulsive, which suggests a strong directional movement. The structure currently analyzed is orange wave 3.
In the context of the Elliott Wave framework, this position sits within a larger degree labeled as navy blue wave 3, continuing the broader bullish trend. Multiple smaller waves contribute to this overall market direction. The next expected phase is orange wave 4, which typically follows after orange wave 3. Wave 4 generally represents a corrective phase, but as of now, orange wave 3 is still ongoing, indicating further upside potential before any correction begins.
The prior wave, orange wave 2, is considered complete, setting up the continuation of orange wave 3. This wave marks a crucial phase in the impulsive trend, reflecting the market's ongoing bullish momentum.
A key invalidation level is set at 7,625.9. If the market falls below this point, the wave analysis would be invalidated, and the current wave structure would no longer apply. This level is critical for traders, as the market must stay above it to maintain the bullish outlook.
Overall, the Elliott Wave analysis suggests a continuation of the bullish trend, with wave 3 still evolving. However, traders should watch the 7,625.9 level closely, as any drop below this point would invalidate the current wave count.
S&P/ASX 200 Index Elliott Wave technical analysis [Video]
Author

Peter Mathers
TradingLounge
Peter Mathers started actively trading in 1982. He began his career at Hoei and Shoin, a Japanese futures trading company.


