S&P/ASX 200 index Elliott Wave technical analysis [Video]
![S&P/ASX 200 index Elliott Wave technical analysis [Video]](https://editorial.fxstreet.com/images/Markets/Equities/Mexbolsa/mexican-stock-exchange-or-bolsa-mexicana-de-valores-mexico-city-45071436_XtraLarge.jpg)
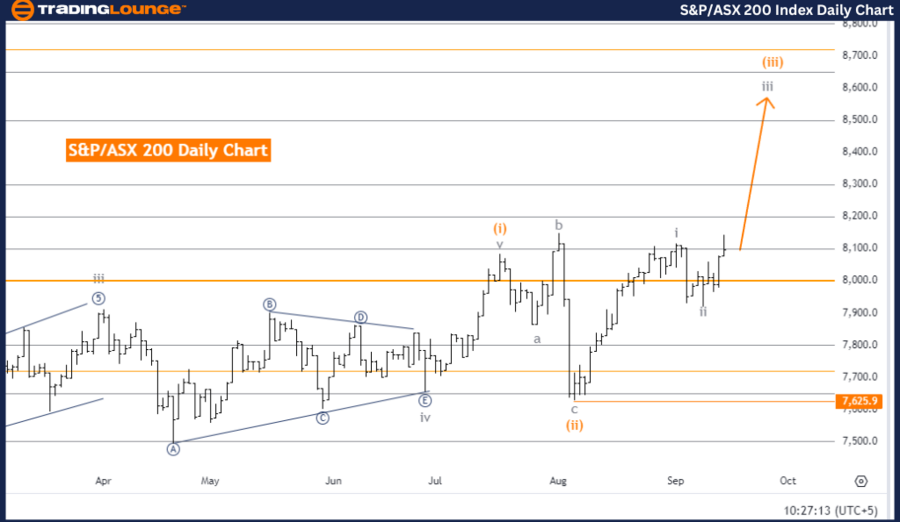
S&P/ASX 200 Elliott Wave Analysis - Day Chart.
S&P/ASX 200 Elliott Wave technical analysis
-
Function: Trend.
-
Mode: Impulsive.
-
Structure: Gray wave 3.
-
Position: Orange wave 3.
-
Next lower degree: Gray wave 4.
-
Details: Gray wave 2 is now considered complete. The market is currently in gray wave 3 of orange wave 3.
-
Invalidation level: 7,625.9
The S&P/ASX 200 Elliott Wave Analysis on the day chart indicates a strong trending market, with an impulsive mode currently active. The main wave structure in focus is gray wave 3, signaling continued upward momentum in the market. The current position is within orange wave 3, which is part of the larger gray wave 3. This indicates that the market is experiencing a bullish phase with expectations of further upward movement.
The analysis notes that gray wave 2 has already been completed, and now gray wave 3 of orange wave 3 is in progress. This transition from the corrective phase (wave 2) to the impulsive phase (wave 3) usually sees a stronger price movement following the prevailing trend. The next significant point to watch is the development of gray wave 4, which will occur after the completion of gray wave 3.
An important aspect of this analysis is the invalidation level set at 7,625.9. If the market falls below this level, it would signal a potential change in the wave structure, and a reevaluation of the market's direction might be necessary.
Summary
The S&P/ASX 200 is currently in a strong bullish trend, with both gray wave 3 and orange wave 3 in play. The completion of gray wave 2 and the ongoing progression of gray wave 3 suggest sustained bullish momentum. The invalidation level to watch is 7,625.9, which could signal a reversal or change in the wave structure.
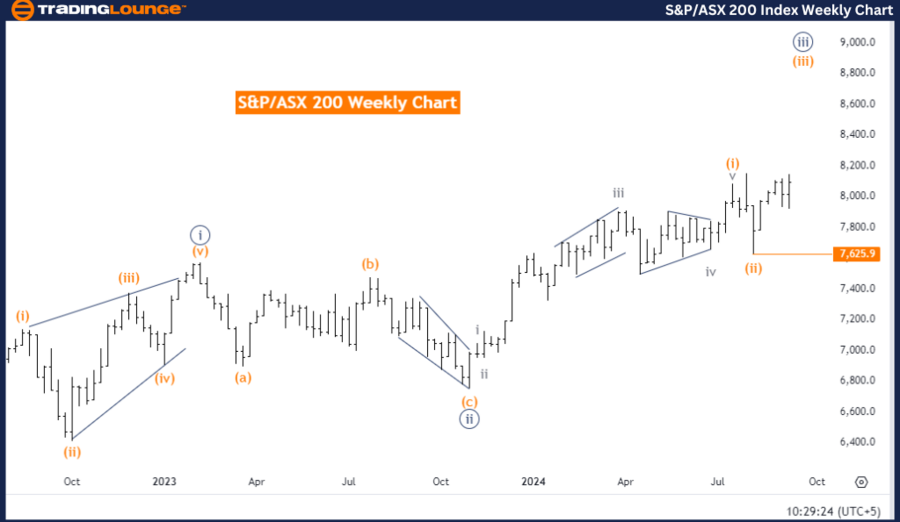
S&P/ASX 200 Elliott Wave Analysis - Weekly Chart
S&P/ASX 200 Elliott Wave technical analysis
-
Function: Trend.
-
Mode: Impulsive.
-
Structure: Orange wave 3.
-
Position: Navy Blue Wave 3.
-
Next lower degree: Orange wave 4.
-
Details: Orange wave 2 is complete. Currently, orange wave 3 of navy blue wave 3 is active.
-
Invalidation level: 7,625.9.
The S&P/ASX 200 Elliott Wave Analysis on the weekly chart shows that the market is following a clear trend in an impulsive mode. The focus is on orange wave 3, which suggests a continuation of the upward trend. The market is now positioned in navy blue wave 3, which is a higher-level wave, indicating a bullish trend remains intact.
As per the analysis, orange wave 2 is considered complete, and the market is progressing through orange wave 3 of navy blue wave 3. This phase typically sees strong price increases as the impulsive wave 3 advances, often representing the most dynamic part of the wave structure.
The next phase to watch for is orange wave 4, which will come into play once orange wave 3 is complete. Orange wave 4 will likely represent a corrective phase after the current impulsive movement. However, the overall trend remains bullish for now.
A key point to monitor is the invalidation level at 7,625.9. If the market falls below this level, the current wave structure and bullish outlook could be invalidated, potentially signaling a need for reassessment.
Summary
The S&P/ASX 200 is in a strong upward trend, with both orange wave 3 and navy blue wave 3 in progress. The completion of orange wave 2 and the ongoing impulsive phase suggest continued bullish momentum. The key invalidation level to watch is 7,625.9, which could indicate a potential change in the wave structure if breached.
Technical analyst: Malik Awais.
S&P/ASX 200 Elliott Wave technical analysis [Video]
Author

Peter Mathers
TradingLounge
Peter Mathers started actively trading in 1982. He began his career at Hoei and Shoin, a Japanese futures trading company.


