S&P/ASX 200 Index Elliott Wave technical analysis [Video]
![S&P/ASX 200 Index Elliott Wave technical analysis [Video]](https://editorial.fxstreet.com/images/Markets/Equities/SP500/wall_street_nyse2-637299021353183737_XtraLarge.jpg)
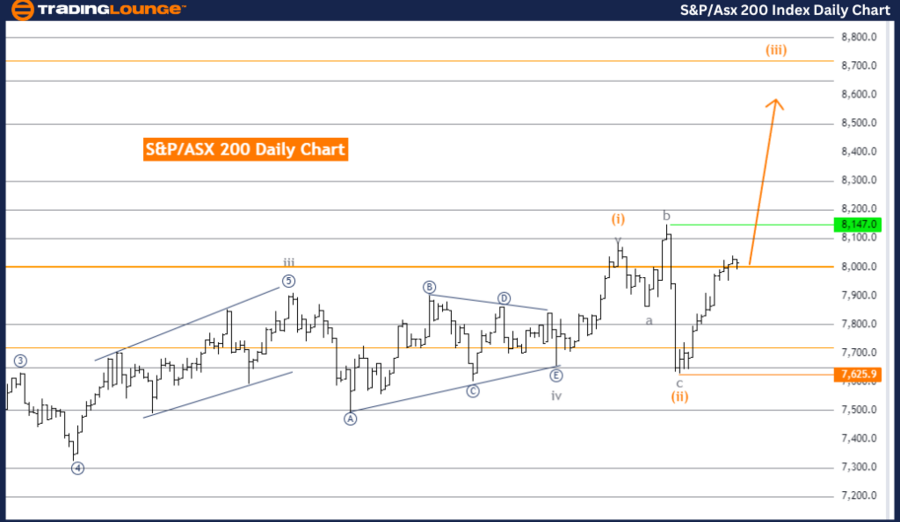
S&P/ASX 200 Elliott Wave technical analysis
Function: Trend.
Mode: Impulsive.
Structure: Orange wave 3.
Position: Navy blue wave 3.
Direction next lower degrees: Orange wave 4.
Details: Orange wave 2 appears to be completed. Now, orange wave 3 of navy blue wave 3 is in play. Wave Cancel invalid level: 7,625.9
The S&P/ASX 200 is currently experiencing a strong trend according to the Elliott Wave analysis on the daily chart. The market is moving in an impulsive mode, indicating a clear and decisive upward trajectory. The primary wave structure being observed is orange wave 3, a critical phase in the Elliott Wave sequence, often associated with significant momentum and price movement.
The market's current position lies within navy blue wave 3, which is part of the larger orange wave 3 structure. This suggests that the market is in the midst of a powerful upward trend, as wave 3 in Elliott Wave theory is typically one of the most extended and forceful waves, driving the market higher. The completion of orange wave 2 indicates that the market has finished its corrective phase and has now entered the next impulsive phase, specifically orange wave 3.
As orange wave 3 of navy blue wave 3 is now unfolding, the market is expected to maintain its upward momentum. This wave is crucial as it often represents the strongest part of the trend, leading to further gains in the market. The analysis also indicates that the direction of the next lower degrees aligns with the ongoing movement of orange wave 3, further reinforcing the expectation of continued upward momentum.
A critical level to watch is 7,625.9, identified as the wave cancel invalid level. If the market were to drop below this level, it would invalidate the current wave count, suggesting that the anticipated wave structure is no longer applicable. This level serves as an important indicator to confirm the validity of the ongoing Elliott Wave analysis.
In summary, the S&P/ASX 200 is in a strong upward trend, with orange wave 3 progressing within the broader navy blue wave 3 structure. The completion of orange wave 2 signals further upward movement, with 7,625.9 as a key level to monitor for the continuation of this wave structure.
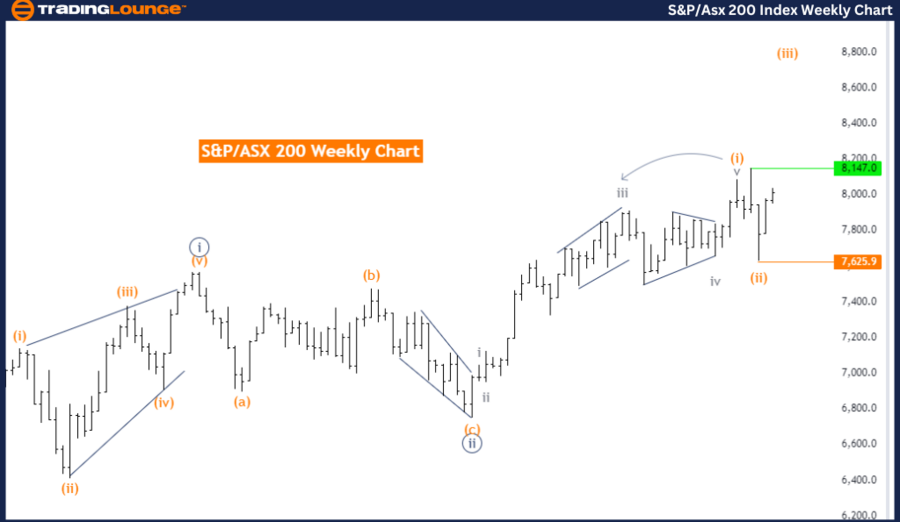
S&P/ASX 200 Elliott Wave technical analysis
Function: Trend.
Mode: Impulsive.
Strucutre: Orange wave 3.
Position: Navy blue wave 3.
Direction next lower degrees: Orange wave 4.
Details: Orange wave 2 appears to be completed. Now, orange wave 3 of navy blue wave 3 is in play. Wave Cancel invalid level: 7,625.9
The S&P/ASX 200 is currently in a strong upward trend according to the Elliott Wave analysis on the weekly chart. The analysis suggests that the market is in an impulsive mode, indicating a decisively bullish movement with strong momentum driving prices higher. The key wave structure being observed is orange wave 3, a critical phase in the Elliott Wave sequence, often characterized by significant and sustained upward price movements.
At present, the market is positioned within navy blue wave 3, which is part of the larger orange wave 3. This indicates that the market is in a particularly strong phase of its upward trend, as wave 3s are often the most powerful and extended waves within the Elliott Wave structure. The analysis indicates that orange wave 2 has been completed, implying that any previous corrective or downward movement has likely ended, and the market has now resumed its upward trend with the initiation of orange wave 3 within navy blue wave 3.
The direction of the next lower degrees aligns with the ongoing orange wave 3, suggesting that the bullish momentum is expected to continue. This phase typically involves strong and sustained price increases as the trend gains momentum and investor confidence builds.
A critical level to monitor is 7,625.9, identified as the wave cancel invalid level. If the market were to fall below this level, it would suggest that the current wave count and anticipated trend might be invalidated, signaling a potential shift in the market's direction. This level serves as an important reference point for confirming the ongoing bullish trend.
In summary, the S&P/ASX 200 is experiencing a strong upward trend, with orange wave 3 currently active within the broader navy blue wave 3. The completion of orange wave 2 indicates that the market is in a phase of robust upward movement, with 7,625.9 being a key level to watch for the continuation of this trend.
S&P/ASX 200 Index Elliott Wave technical analysis [Video]
Author

Peter Mathers
TradingLounge
Peter Mathers started actively trading in 1982. He began his career at Hoei and Shoin, a Japanese futures trading company.


