S&P/ASX 200 index Elliott Wave technical analysis [Video]
![S&P/ASX 200 index Elliott Wave technical analysis [Video]](https://editorial.fxstreet.com/images/Markets/Equities/SP500/wall_street_nyse1-637299020939878938_XtraLarge.jpg)
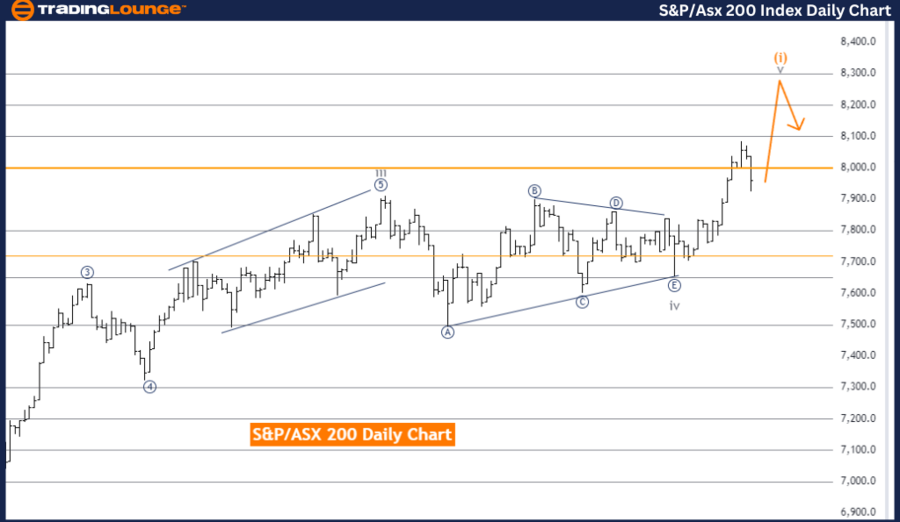
S&P/ASX 200 Elliott Wave Analysis Day Chart.
S&P/ASX 200 Elliott Wave technical analysis
Trend Analysis
-
Function: Trend.
-
Mode: Impulsive.
-
Structure: Gray wave 5.
-
Position: Orange wave 1.
-
Next lower degrees direction: Orange wave 2.
Analysis Details
The S&P/ASX 200 Elliott Wave Analysis on the daily chart provides a technical overview of the Australian stock market index using Elliott Wave Theory. This analysis focuses on identifying the current market trend, which is classified as impulsive. An impulsive trend indicates that the market is in a strong, directional move, usually consisting of five waves moving in the primary direction of the trend.
Current Wave Structure
The current wave structure under observation is gray wave 5, which is the final wave in a sequence of five waves. This signifies the completion of a larger impulsive move. Within this structure, the position is at orange wave 1, suggesting that the market is at the beginning of a new impulsive phase following the completion of the gray wave 5.
Next Lower Degree Direction
The direction for the next lower degrees is indicated as orange wave 2. This implies that after the completion of orange wave 1, a corrective phase, orange wave 2, will follow before resuming the larger trend. The corrective phase in orange wave 2 is expected to temporarily move against the direction of the primary trend.
Detailed Insights
Details in the analysis highlight that gray wave 4 appears to be completed, and now gray wave 5 of 1 is in play. This indicates that the market has finished a corrective phase (gray wave 4) and has entered the final impulsive phase (gray wave 5) of the current sequence. The completion of gray wave 5 will mark the end of the larger impulsive move and the beginning of a new corrective or impulsive phase.
Summary
-
The S&P/ASX 200 daily chart analysis identifies the market as being in an impulsive trend, currently in gray wave 5, with the position at orange wave 1.
-
The next anticipated phase is orange wave 2, which will follow the completion of orange wave 1.
-
The analysis suggests that gray wave 4 is completed, and gray wave 5 of 1 is now in progress.
-
This indicates the market is in the final stage of its current impulsive sequence before entering the next phase of movement.
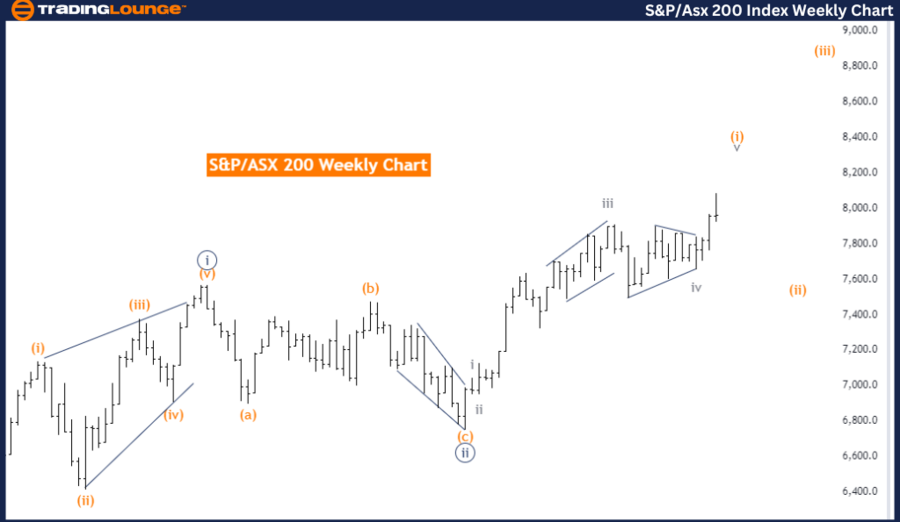
S&P/ASX 200 Elliott Wave Analysis Weekly Chart.
S&P/ASX 200 Elliott Wave technical analysis
Trend Analysis
-
Function: Trend.
-
Mode: Impulsive.
-
Structure: Orange wave 1.
-
Position: Navy blue wave 3.
-
Next lower degrees direction: Orange wave 2.
Analysis Details
The S&P/ASX 200 Elliott Wave Analysis on the weekly chart offers a technical view of the Australian stock market index using Elliott Wave Theory. This analysis shows the market in a trend function with an impulsive mode, indicating a strong directional movement generally consisting of five waves.
Current Wave Structure
The current wave structure identified is orange wave 1, suggesting the market is at the start of a new impulsive phase. The position within this structure is navy blue wave 3, the third wave in a larger impulsive movement. The third wave is typically the most robust and dynamic part of the Elliott Wave sequence.
Next Lower Degree Direction
The next lower degree direction is orange wave 2, expected to follow the completion of orange wave 1. Orange wave 2 represents a corrective phase, which usually moves against the primary trend direction before the larger impulsive movement resumes.
Detailed Insights
Orange wave 1 of 3 is currently nearing its end. Once orange wave 1 of 3 completes, the market is anticipated to enter orange wave 2 of 3, a corrective phase providing a temporary retracement in the market's upward trend before the next impulsive wave, orange wave 3 of 3, begins.
Summary
-
The S&P/ASX 200 is in an impulsive trend, currently in orange wave 1.
-
The position is at navy blue wave 3, the third and often most dynamic wave in the sequence.
-
The next phase is expected to be orange wave 2, following the near completion of orange wave 1 of 3.
-
The analysis indicates the market is in the third wave of a larger impulsive sequence, and a corrective phase (orange wave 2 of 3) is anticipated before the next impulsive movement resumes.
Technical analyst: Malik Awais.
S&P/ASX 200 Elliott Wave technical analysis [Video]
Author

Peter Mathers
TradingLounge
Peter Mathers started actively trading in 1982. He began his career at Hoei and Shoin, a Japanese futures trading company.


