S&P/ASX 200 Elliott Wave technical analysis [Video]
![S&P/ASX 200 Elliott Wave technical analysis [Video]](https://editorial.fxstreet.com/images/Markets/Equities/SP500/wall_street_nyse2-637299021353183737_XtraLarge.jpg)
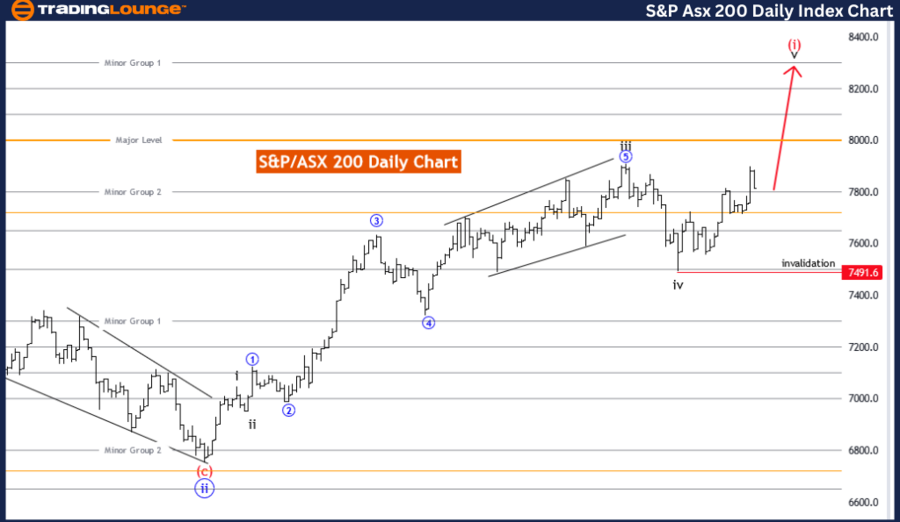
S&P/ASX 200 Elliott Wave Analysis Trading Lounge Day Chart,
S&P/ASX 200 Elliott Wave technical analysis
Function: Trend
Mode: Impulsive
Structure: Black wave 5
Position: Red wave 1
Direction next lower degrees: Red wave 2
Details: Black wave 4 looking completed. Now black wave 5 of 1 is in play.
Wave cancel invalid level: 7495.3
The S&P/ASX 200 Elliott Wave analysis on the daily chart focuses on identifying and following the market trend. The analysis highlights an impulsive mode, indicating that the market is currently in a strong directional movement. Impulsive waves are characterized by five-wave structures that move in the direction of the larger trend.
The current structure under examination is black wave five, suggesting that the market is in the fifth and final wave of an impulsive sequence. The position within this structure is identified as red wave one, indicating the beginning phase of a new wave cycle within the larger trend.
The analysis further outlines the direction for the next lower degrees as red wave two. This implies that after the completion of the current impulsive phase (black wave five), the market is expected to enter a corrective phase, typically a three-wave structure, retracing part of the impulsive move.
Detailed examination indicates that black wave four appears to be completed. Consequently, the market is now engaged in black wave five of red wave one. This final wave of the impulsive sequence suggests a continuation of the current trend until the wave completes.
An important aspect of the analysis is the wave cancel invalid level, set at 7491.6. If the market surpasses this level, the current wave count would be invalidated, requiring a reassessment of the wave structure and potentially indicating a change in market behavior.
In summary, the S&P/ASX 200 Elliott Wave analysis on the daily chart identifies a trending and impulsive market phase within black wave five. Currently, the market is in the initial stages of red wave one, with expectations of transitioning to red wave two following the completion of the current wave. The analysis provides a crucial invalidation level to monitor, guiding traders on potential trend continuation and correction phases.
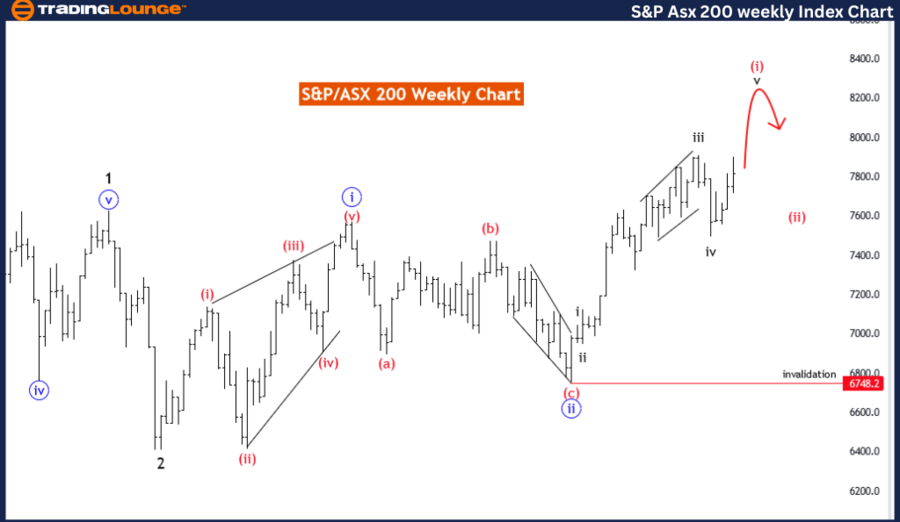
S&P/ASX 200 Elliott Wave technical analysis weekly chart
Function: Trend
Mode: Impulsive
Structure: Black wave 5
Position: Red wave 1
Direction next lower degrees: Red wave 2
Details: Black wave 4 looking completed. Now black wave 5 of 1 is in play.
Wave cancel invalid level: 6748.2
The S&P/ASX 200 Elliott Wave analysis on the weekly chart provides a detailed examination of the market's trend dynamics. The analysis identifies the function as following a trend, indicating that the market is currently experiencing a strong directional movement.
The mode of the trend is described as impulsive, which is characterized by five-wave structures moving in the direction of the larger trend. The current wave structure being analyzed is black wave five, suggesting that the market is in the final phase of an impulsive sequence. This phase typically culminates the larger trend before a corrective phase begins.
The specific position within this wave structure is identified as red wave one. This denotes the initial phase of a new wave cycle within the larger impulsive sequence. Following this, the analysis indicates the next lower degrees direction as red wave two, implying that after the completion of the current impulsive phase, the market is expected to enter a corrective phase. This phase typically involves a three-wave structure that retraces a portion of the previous impulsive move.
The analysis provides detailed observations that black wave four appears to be completed. As a result, the market is currently engaged in black wave five of red wave one. This indicates that the market is in the final push of the current impulsive phase, which will likely be followed by a corrective phase.
An important component of the analysis is the wave cancel invalid level, set at 6748.2. This level serves as a critical threshold. If the market exceeds this level, the current wave count would be invalidated, necessitating a reassessment of the wave structure and potentially signaling a shift in market behavior.
In summary, the S&P/ASX 200 Elliott Wave analysis on the weekly chart indicates that the market is in the final phase of an impulsive trend, specifically black wave five. Currently, the market is in the early stages of red wave one, with an expectation of transitioning to red wave
two after the completion of the current wave. The analysis highlights a key invalidation level to monitor, guiding traders on potential trend continuation and corrective phases.
S&P/ASX 200 Elliott Wave technical analysis [Video]
Author

Peter Mathers
TradingLounge
Peter Mathers started actively trading in 1982. He began his career at Hoei and Shoin, a Japanese futures trading company.


