S&P 500 update: These four indicators point towards a rally
This article will cover several indicators we track for our premium members. These indicators can help those who understand that “big time frames lead to big gains” determine if a significant low has been struck.
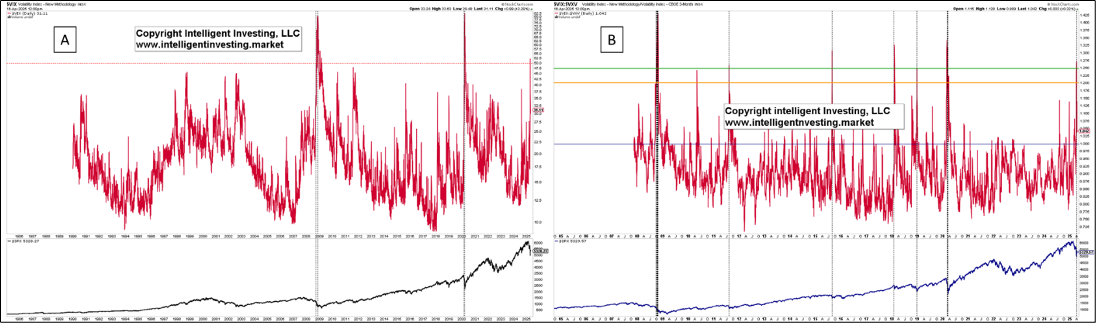
The Volatility Index (VIX), aka the “fear gauge,” which measures the market's expectations of 30-day volatility for the S&P500 (SPX), had its 3rd highest reading in early April (52.3) since data became available in 1989. See Figure 1A below. The two prior occasions were during the 2008 bear market and the 2020 COVID-19 crash. Besides, when we include the 3-month Volatility Index (VXV) and make a ratio (VIX/VXV), we can identify more lows with spikes above 1.25. Earlier this month, the ratio spiked to 1.274 and now sits at 1.028. Although not all occasions were “the low,” all were excellent buying opportunities.
Figure 1. Volatility Index (VIX) (30 days) and the VIX/VXV (3 months out) ratio
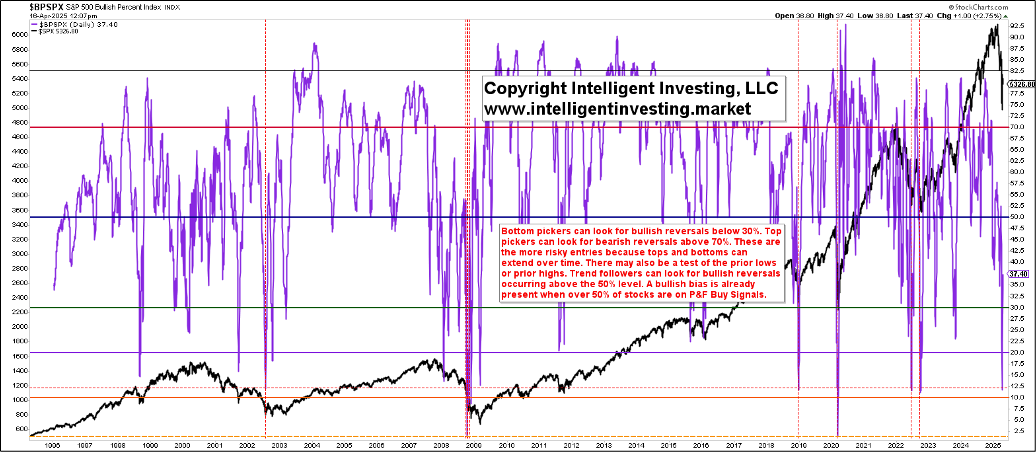
Next up is the Bullish Percent Index (BPI) for the SPX. The BPI tells us how many individual stocks that comprise an index, such as the SPX, are on a buy signal (point-and-figure chart). Aka, “it’s a market of stocks, not a stock market.” See Figure 2 below. Earlier this month, the BPI dropped to as low as 11.80. That is as low as during the 2022 bear market, the 2020 flash crash, and the 2019 correction. Before that, only the 2008 bear market eclipsed that low a reading. All occasions were excellent buying opportunities.
Figure 2: The bullish percent index
In one of our previous articles, we covered the 52-week New Lows (NYLOW) indicator and found that although it had spiked to 1152 earlier this month, no new bear market was identified. Besides, when we look at all instances when the NYLOW spiked over 1000 since 1965, we find that all but one (2007) were great long-term buying opportunities: 1987, 1998, 2008, 2011, 2015, 2019, 2020, and 2022. See Figure 3 below.
Figure 3. The 52-week new lows
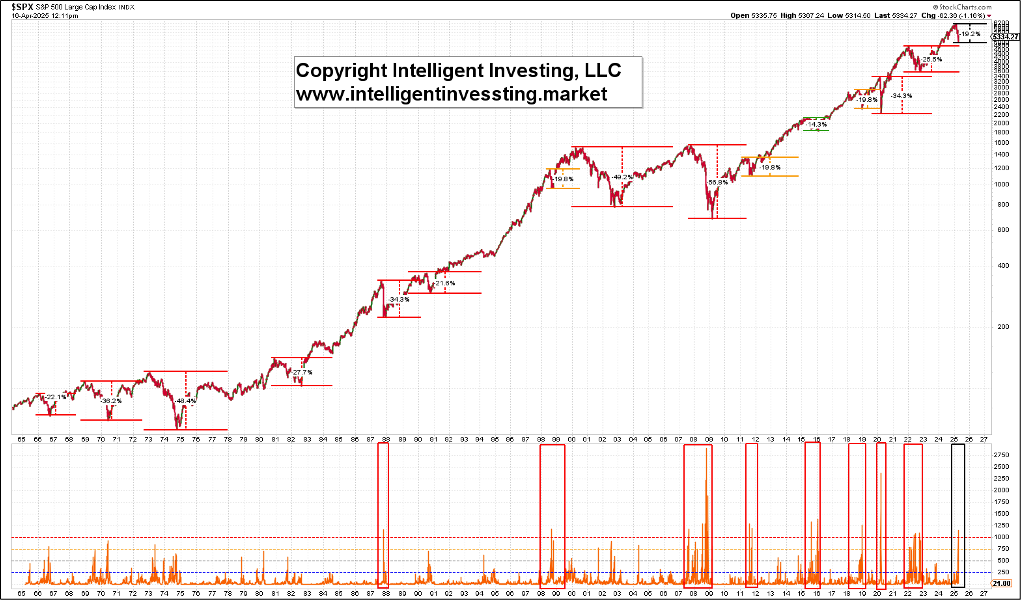
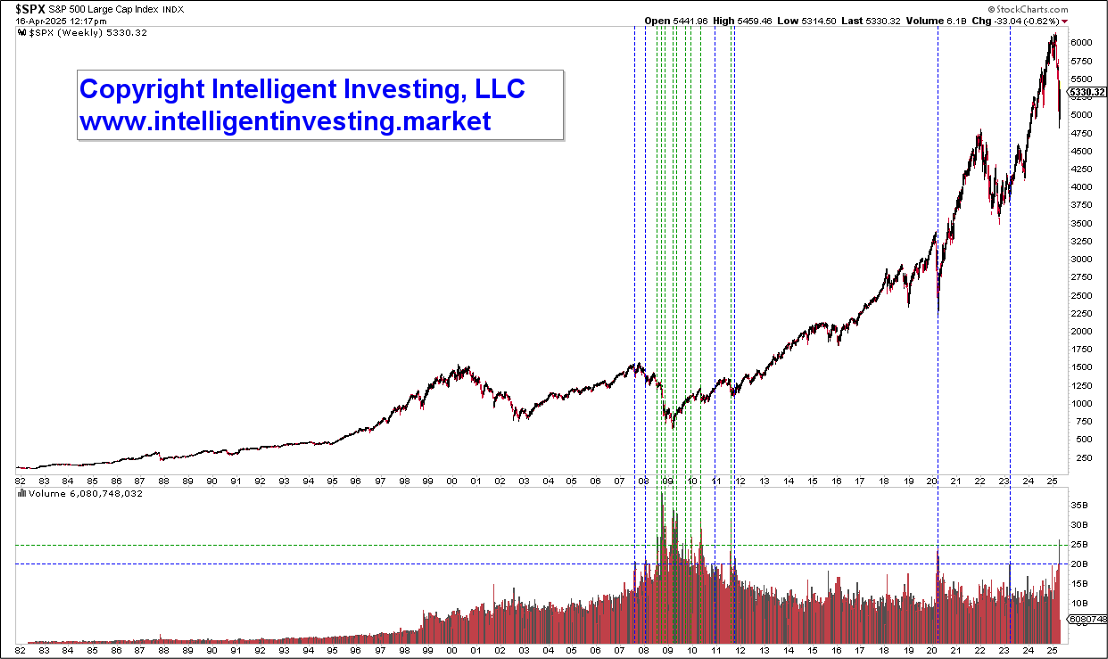
Speaking of spikes: During the recent “tariff crash,” the volume on the SPX spiked to over 25 billion. See Figure 4 below. Such high spikes are rare: Since the early 1980s, they have only occurred in 2011 and 2008-2010. Expanding it to 20 billion, we can include early 2023, 2020, 2011, and 2007. Thus, high volume spikes occur only during bear markets and at the start of new bull markets when smart money, i.e., large institutions, are buying as they often have a long-term view.
Figure 4. Weekly volume spikes over 25 and 20 billion
Tracking and sharing these four indicators helped our premium members take a healthy, long-term view of appropriate action. We hope it does the same for you. Of course, past performance is no guarantee of future success. But if history shows that the weight of the evidence of these extreme readings points towards a great risk/reward setup in the long run, all we can do is act upon it.
In our previous two updates, we signed off with “Take a deep breath and zoom out. There are still no signs of a bear market. Even if there is one, history shows us that each Bear market is a Major Buying Opportunity (BIMBO) for those with a time horizon longer than a few days to weeks,” which these four indicators underscore.
Author

Dr. Arnout Ter Schure
Intelligent Investing, LLC
After having worked for over ten years within the field of energy and the environment, Dr.


