S&P 500 testing notable support

US jobless claims, as expected
On the wires today, US jobless claims came in as expected for the week ending 25 November at 218,000. The 218k print was higher than the prior week (ending 18 November), revised slightly higher to 211,000. Continued jobless claims, or the insured employment rate, was 1.927 million, a whisker above the estimated range high of 1.92 million, marking an 86,000 increase from the previous print. The US Department of Labor communicated, ‘This is the highest level for insured unemployment since November 27 2021, when it was 1,964,000. The 4-week moving average showed a small decrease of 500, down to 220,500.
US PCE inflation eases, as expected
Also on the radar for many today, of course, was the Personal Income and Outlays release for October. Personal income increased by 0.2% from September to October, down from 0.4%, with spending also up by 0.2%, down from 0.7% the month prior. As a note, both the month-on-month releases were as expected by economists. Headline PCE deflator was flat on the month, bringing the year-on-year measure to 3.0%, down from 3.4%, the lowest since the pandemic. The core measure, which excludes food and energy, was 0.2%, slightly down from 0.3% the month prior, which pushed the core year-on-year figure to 3.5% from 3.7%.
The release from the Bureau of Economic Analysis (BEA) noted that despite an increase in food prices (+0.2%), energy prices cooled by 2.6% from September to October. Goods saw a -0.3% fall while services increased 0.2%.
Essentially, the jobless claims release and the PCE data all came in as economists forecasted and show that inflationary pressures continue to subside in the US economy. In addition to a softening jobs market, the latest round of inflation numbers increases the odds of the Fed cutting sooner than expected, with some desks noting that the ‘Fed pivot’ is nearing. As of writing, around 113 bps of cuts have been priced into the market for 2024, with the first 25bp cut fully priced in for May’s policy meeting. Interestingly, there’s also a 45% probability for a 25bp cut as early as March.
S&P 500 charts
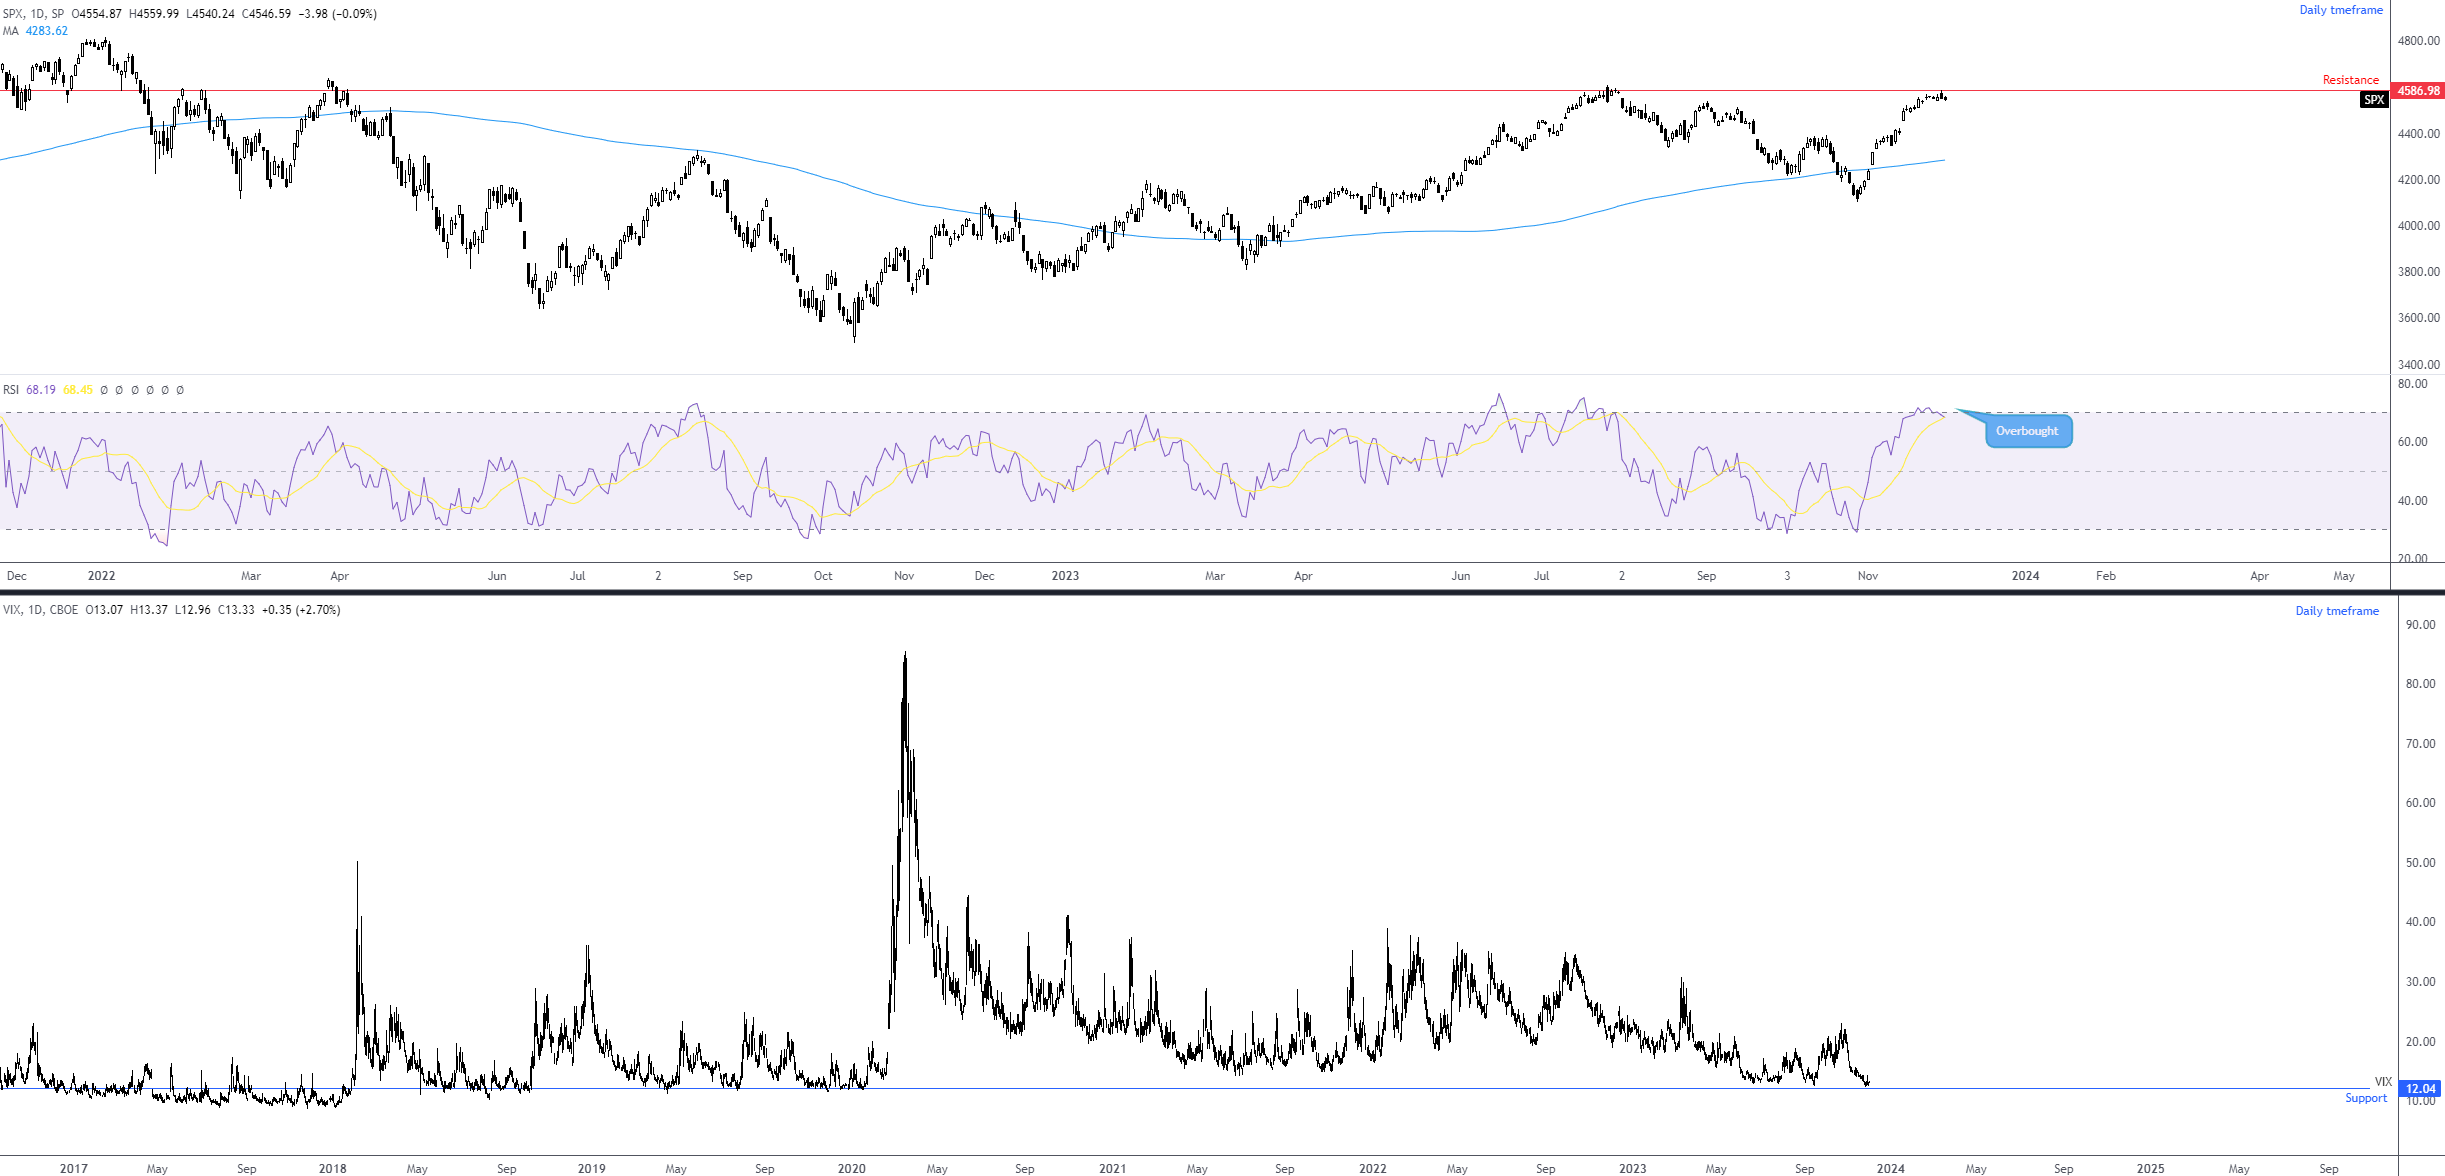
In the equity space, the S&P 500 is down as of writing. This follows yesterday shaking hands with resistance on the daily timeframe at 4,578, a level positioned just south of the weekly timeframe’s resistance at 4,595. Of note on the weekly scale, you’ll see current price is on track to pencil in a bearish shooting star candlestick pattern. Should the unit push through bids at daily support from 4,541, this would potentially open the door to a bearish scenario to at least support on the daily scale at 4,473.
A correction from current price also aligns with a post from the Research Team that was released in today’s Pattern Pulse. The piece noted the following:
The CBOE Volatility Index (VIX), one of the most recognised and respected measures of expected equity volatility, shows volatility is at its lowest since early 2020 (pre-pandemic levels). This throws VIX support into the fray at 12.04, a level respected since mid-2018. A rebound from this base, coupled with the Relative Strength Index (RSI) on the daily chart of the S&P 500 displaying an overbought signal, could portend a correction in price action from resistance at 4,586.
-638369654551951305.png)
Source: TradingView
Author

Aaron Hill
FP Markets
After completing his Bachelor’s degree in English and Creative Writing in the UK, and subsequently spending a handful of years teaching English as a foreign language teacher around Asia, Aaron was introduced to financial trading,


