S&P 500 (SPX, SPY) Technical Levels: Records are there to be broken, and that is 2021's trend
- S&P 500 on course for another record high.
- The stock market continues to be supported by flow and fundamentals.
- S&P 500 nearly does the record job on Tuesday.

The stock market continues to march steadily higher as FOMO (fear of missing out) and TINA (there is no alternative) continue to dominative the narrative for 2021. Fear of missing out may be driving the wild swings in the meme stock space but has spread to the broader stock market as well with fund managers rushing to keep up. There is indeed little alternative available in a zero rate world since global central banks have backed themselves into a corner by making stocks the only asset class in town and in the process making the stock market too big to fail.
Is the next step to follow the Bank of Japan and buy ETFs (exchange-traded funds) directly? This really is not the time or place to think too hard about the merits of central bank pumping policy. The facts are the facts, and the market is only doing as it sees fit. The record for the number of record highs in a year has already gone to 2021, and we are only halfway through.
S&P 500 technical levels
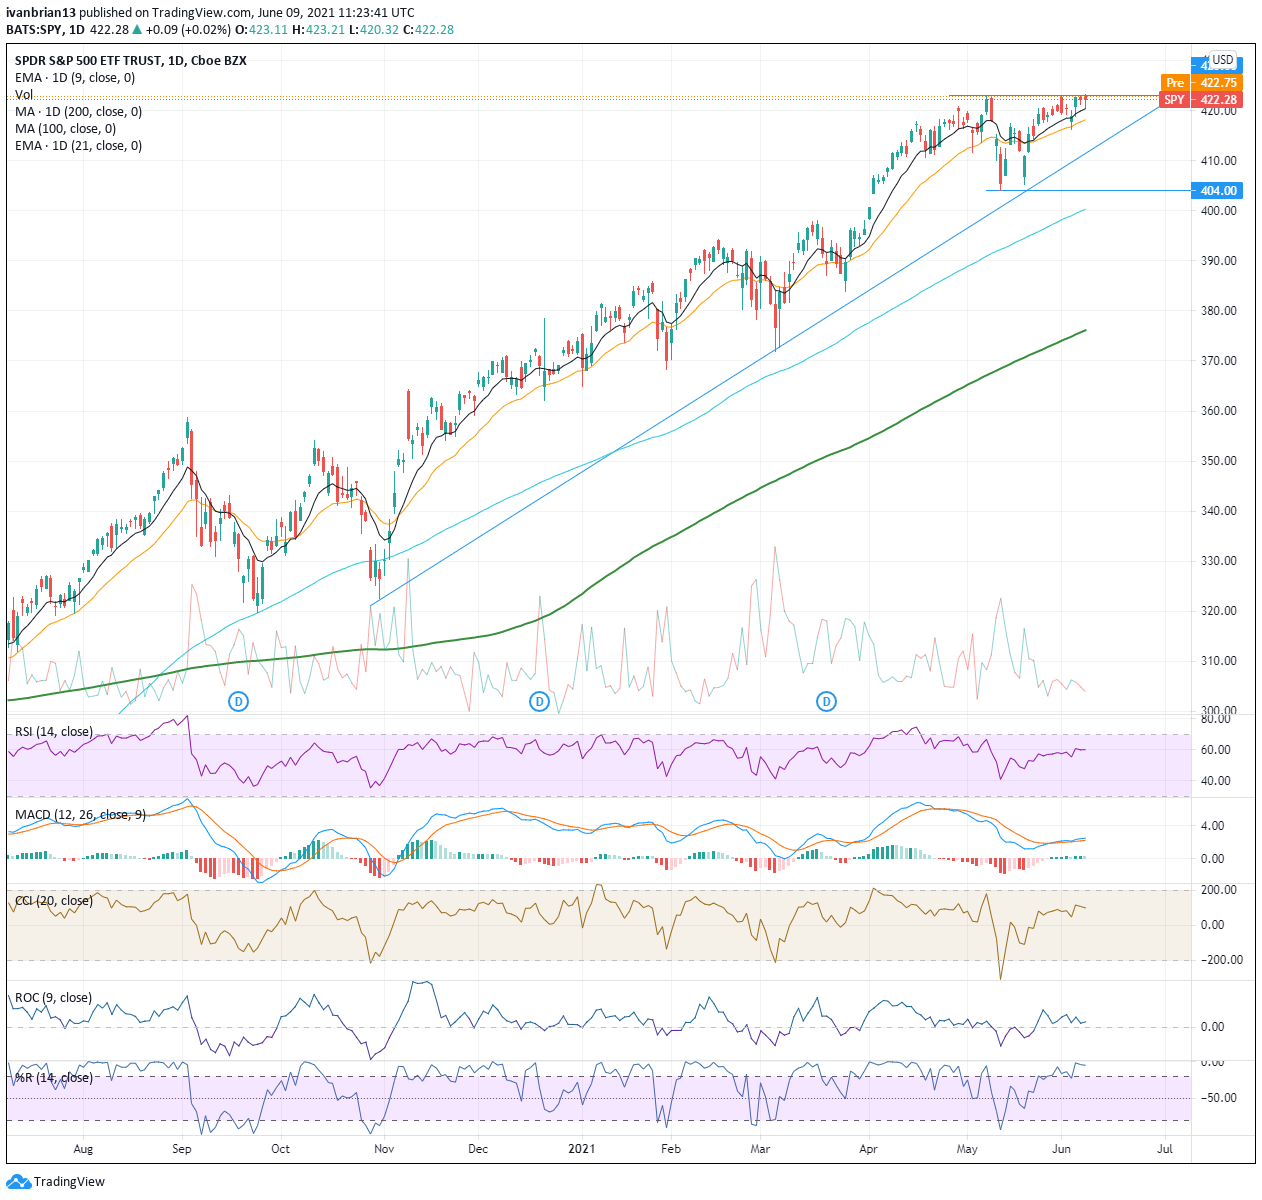
Whatever your choice of poison, the S&P futures, SPY ETF or the cash-indexed SPX all correspond.
The double bottom in place from May 12 and 19 corresponds nicely with the double bottom we spoke of in Tuesday's Nasdaq overview, see more. It always gives extra credence to the levels when the indices align. The strength or lack thereof in the current trend is identified by the Moving Average Convergence Divergence (MACD) indicator being horizontal and gapless. Last week's Thursday wobble held perfectly at the 21-day moving average and the trend, as can clearly be seen, has been using the 9-day moving average quite well. In the SPY ETF, the low from June 3 is a pivot for the very short term at 416.28. Below that, 404 is the long-term pivot.
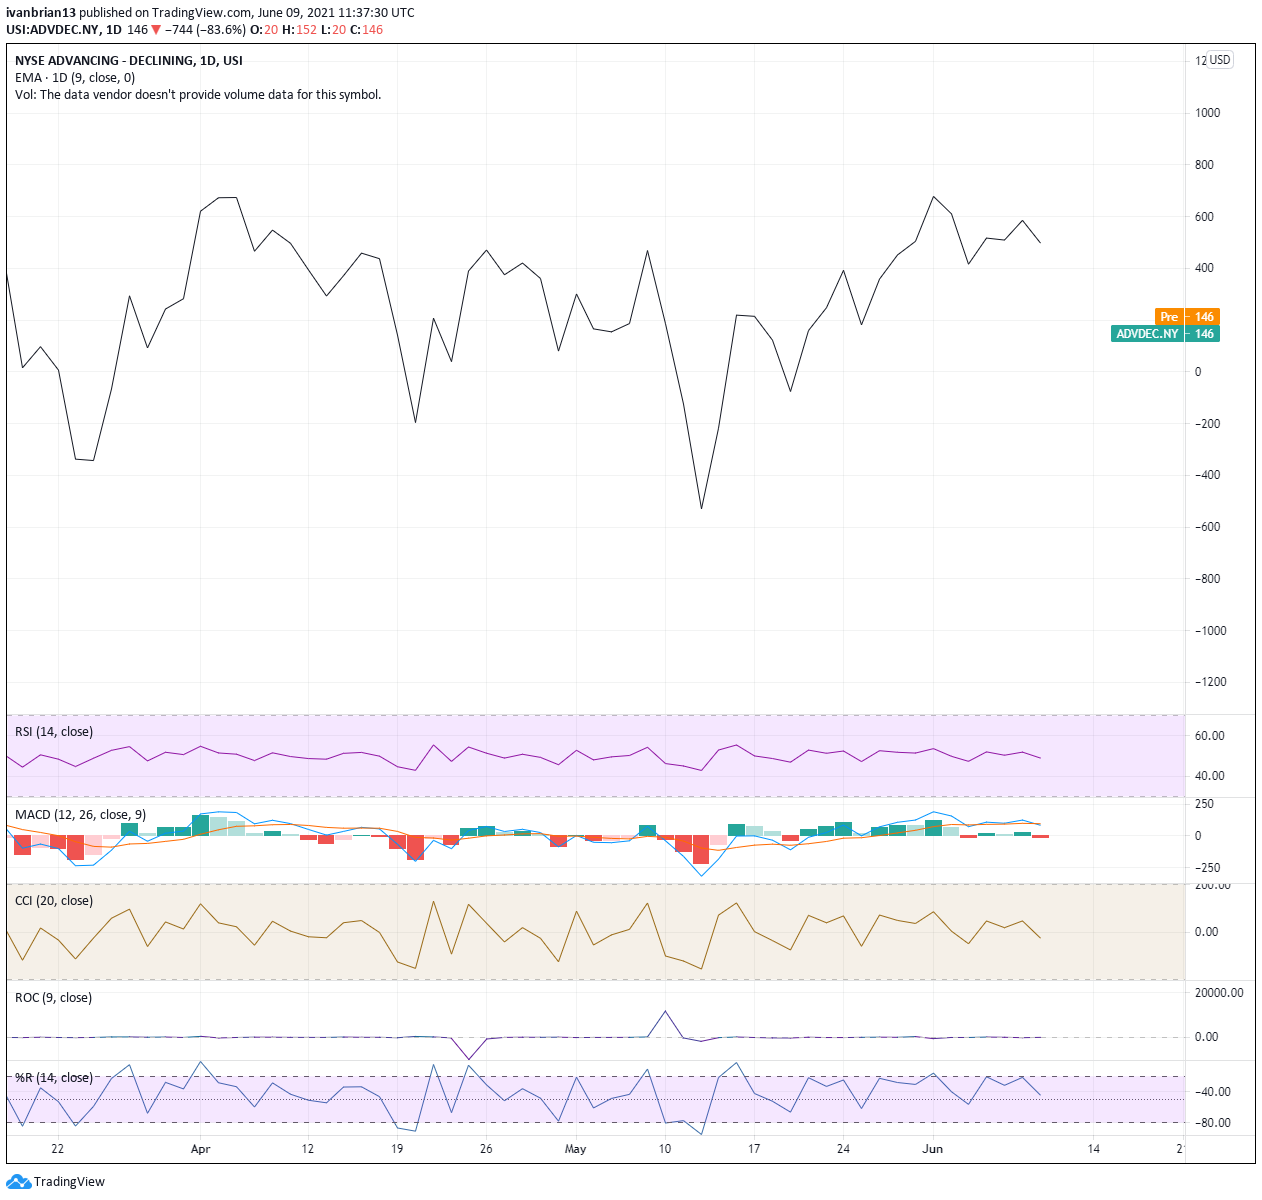
The overall advancing-declining ratio has steadily been signaling the move to fresh highs, having bottomed out along with the S&P 500 on May 12. Significantly, it did not show a double bottom on May 19, a bullish divergence.
A little bit of caution can be taken from the long-term monthly S&P 500 ETF (SPY). This shows a bearish doji star candlestick from May. A doji star is a reversal candle where the previous long green candle is followed by a long doji with an open and close above the previous long green candle. Not always perfect, but it is definitely worth watching. As can be seen, they have not been working that well given the relentless uptrend but can signify some modest pullbacks or slowdown in the uptrend. The monthly Relative Strength Index (RSI) is also just barely in overbought territory.
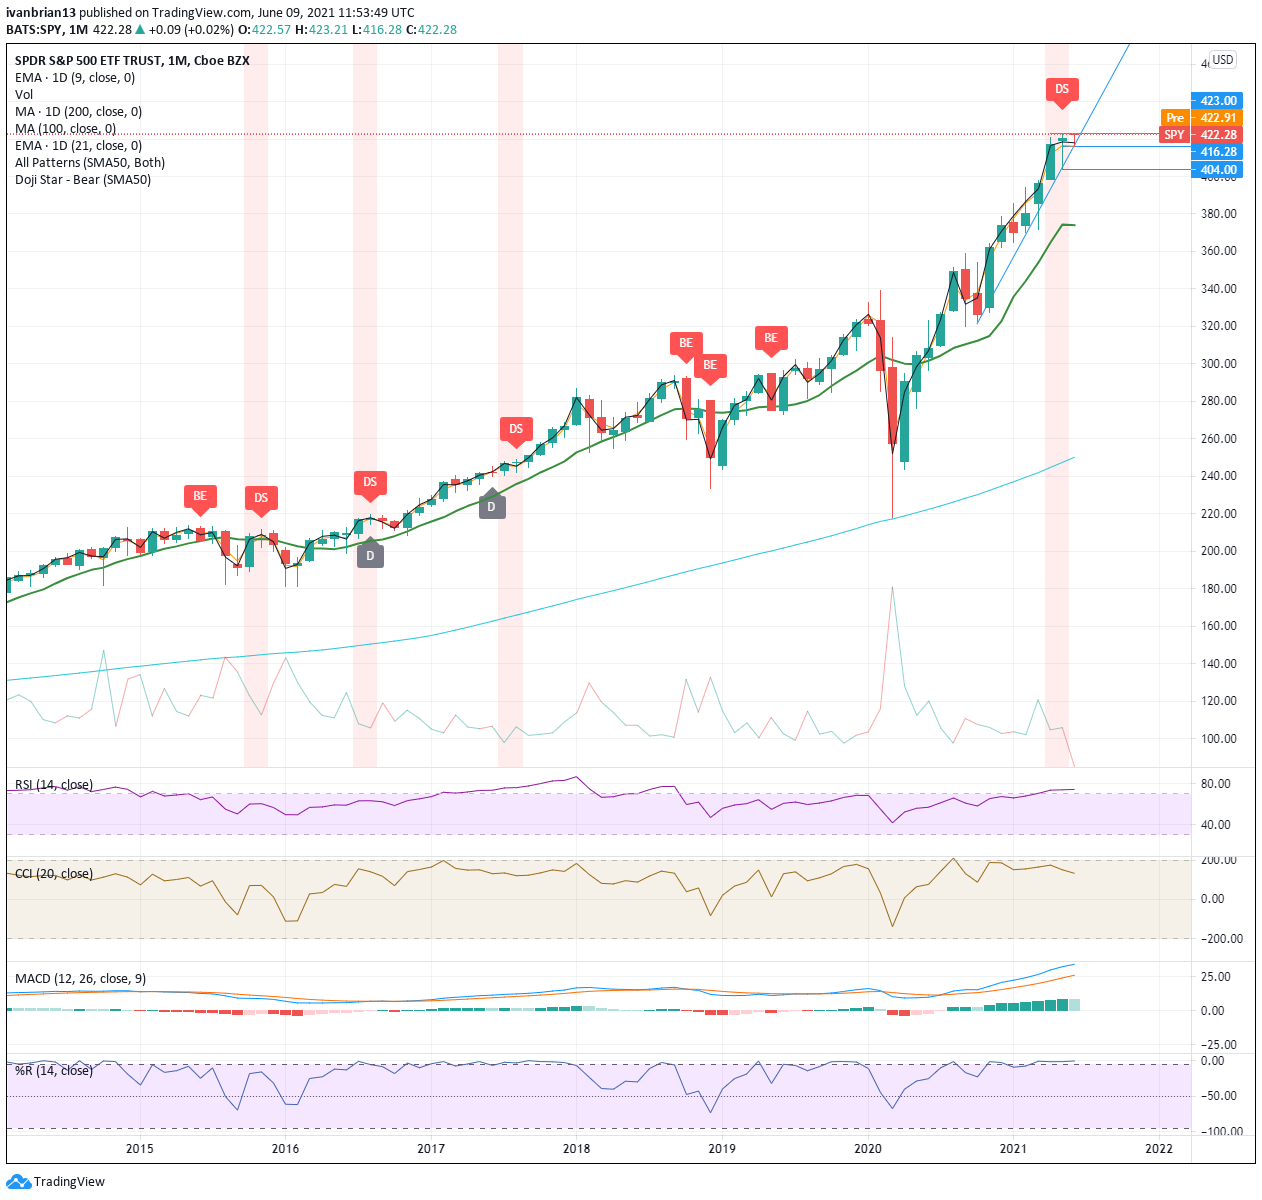
SPDR S&P 500 monthy chart
Author

Ivan Brian
FXStreet
Ivan Brian started his career with AIB Bank in corporate finance and then worked for seven years at Baxter. He started as a macro analyst before becoming Head of Research and then CFO.


