S&P 500 (SPX) Elliott Wave forecasts amid tariff uncertainties

There has been a back and forth regarding the tariff headlines as traders and investors are clouded in uncertainties. Clearly, the economic war has narrowed to a face-off between the US and China. Meanwhile, if we take our eyes away from the headlines, what’s price telling us? In this article, we will use the Elliott wave theory to discuss the possible paths the S&P500 (SPX) could take in the coming weeks.
Early in April, the US President, Donald Trump announced the largely anticipated tariff plans. Shortly afterwards and days after, most assets especially the risk assets started to bleed. Investors panicked and converted to cash until the dust settled. Afterwards, cash flows went into precious metals especially Gold which saw some of it’s biggest gains in the last 100 years. Gold reached record highs multiple times while the US Indices faltered.
However, before the sell-off on the US Indices – S&P500 (SPX) and others, we had anticipated that the bullish cycle from October was getting completed. Thus, we warned members in our live sessions. However, we expected the expected decline to correct the cycle from August 2024 and then turn higher but the trade war impact had forced prices much lower to now correct the bigger bullish cycle from October 2022. In the Elliott wave terms, the bullish cycle from October 2022 marked the start of the wave ((III)) grand supercycle degree. From the lows of October 2022, price completed an impulse sequence for wave (I) of ((III)) in February 2025. Thus, from the high of February, wave (II) emerged. We intended to buy wave (II) if it completed a 3 or 7 swing structure.
SPX: A typical 3 or 7 swing pullback for (II)?
The first impact from the February high was a clear 3-swing decline that ended at the extreme area where we recommended members should buy for some profit.. Price rallied from the extreme as expected. Members reached the first target and are running a risk-free trade after taking partial profit. Going forward, the debate is whether the rally will be corrective or impulsive toward the February high. The chart below shows the scenario where wave ((II)) already finished at the April 2025 low.
SPX four-hour – First scenario
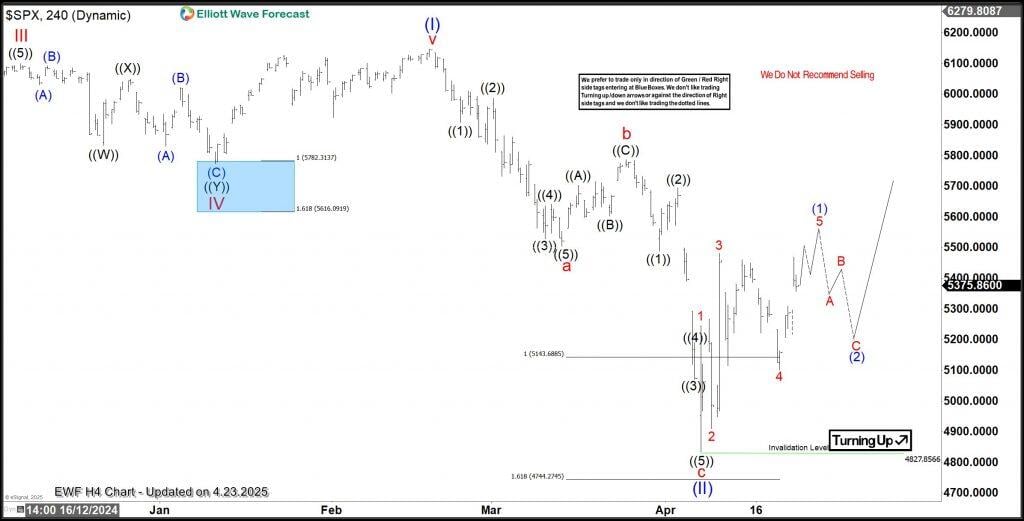
The chart above shows wave (II) may have ended at the April low and the recovery should emerge higher for wave (III) above the February high. If the tariff risks de-escalate, this scenario should work and buyers push higher. However, to add to our long position, we like to see the rebound from April complete a 5-swing. If wave (1) ends with a 5-wave structure, then we can buy the next 3/7 swing pullback from the blue box and join buyers as they push further. However, if the tariff risks escalate, then SPX could push lower from higher prices as the second scenario below shows.
Four-hour – 2nd scenario
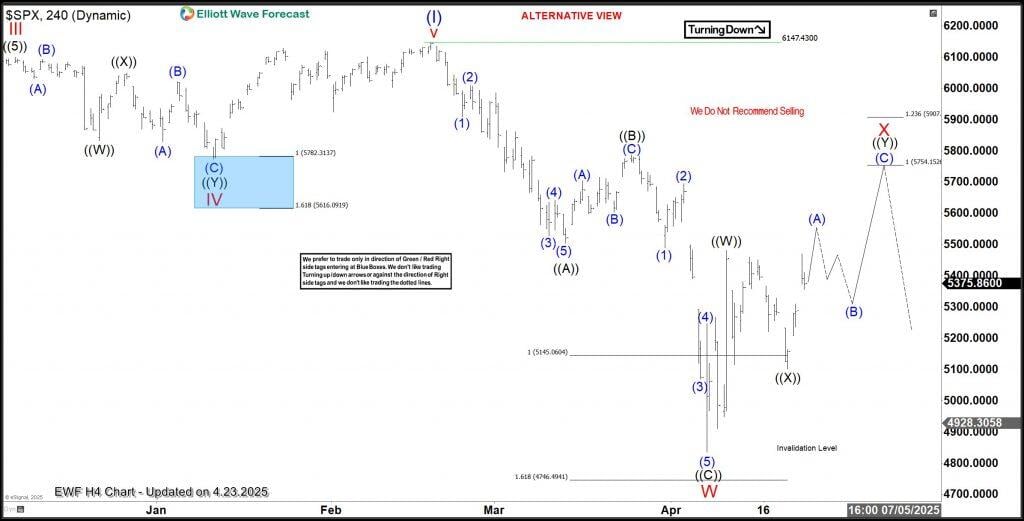
The H4 chart above indicates that wave (II) may develop lower for a deeper 7-swing structure. Corrective structures evolve as 3, 7 or 11 swing sequences. The 3-swing sequence ended wave W. However, the current reaction from the April low can also be interpreted as a a corrective – 7-swing in wave X of (II). Thus, price may still push higher to 5754 or thereabout and then turn sharply lower again. A break below the 4827 low will confirm this scenario. If this happens, we will look to buy lower at the extreme of the 7-swing structure. However, if price breaks below 4827, we could take short term shorts from the extreme of 3 or 7 swing bounces toward the next extreme for wave (II).
No matter what happens between the US and China in the coming days, weeks or months, we already mapped out how we will like to trade SPX. We don’t even need to follow the headlines let alone trading them. All will need is the price action, our Elliott wave skills and our proprietary blue box.
Author

Elliott Wave Forecast Team
ElliottWave-Forecast.com


