S&P 500 retreated from all-time high: Is it just a correction?

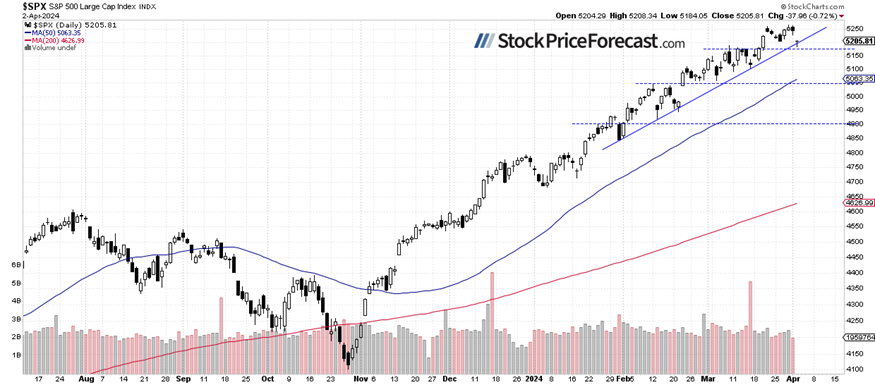
Stocks prices went down on Tuesday as some more pronounced profit-taking action occurred after a relatively flat Monday. The S&P 500 index lost 0.72% yesterday, closing slightly above the 5,200 level. On Friday, it reached a new record high of 5,264.85, and on Monday, it dropped by 0.2%.
Yesterday, in my Stock Price Forecast for April, I noted, “Closing the month of March with a gain of 3.1%, the question arises: Will the S&P 500 further extend the bull market in April, or is a downward correction on the horizon? From a contrarian standpoint, such a correction seems likely, but the overall trend remains bullish.”
The investor sentiment much improved last week; the Wednesday’s AAII Investor Sentiment Survey showed that 50.0% of individual investors are bullish, while only 22.4% of them are bearish, down from 27.2% last week. The AAII sentiment is a contrary indicator in the sense that highly bullish readings may suggest excessive complacency and a lack of fear in the market. Conversely, bearish readings are favorable for market upturns.
This morning, the S&P 500 is likely to open virtually flat, with the futures contract trading 0.1% below its yesterday’s closing price. Consequently, the index will remain close to the 5,200 level. Yesterday, it briefly broke its two-month-long upward trend line, as we can see on the daily chart.
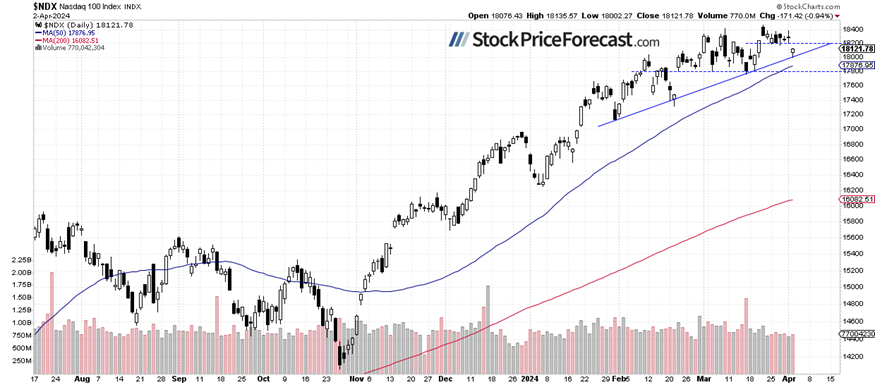
Nasdaq 100 broke below 18,200
On March 21, the technology-focused Nasdaq 100 index reached a new record high of 18,464.70, extending its long-term uptrend, and last week, it retraced closer to the 18,200 level. Yesterday, the market broke below the recent trading range, returning to its over month-long consolidation.
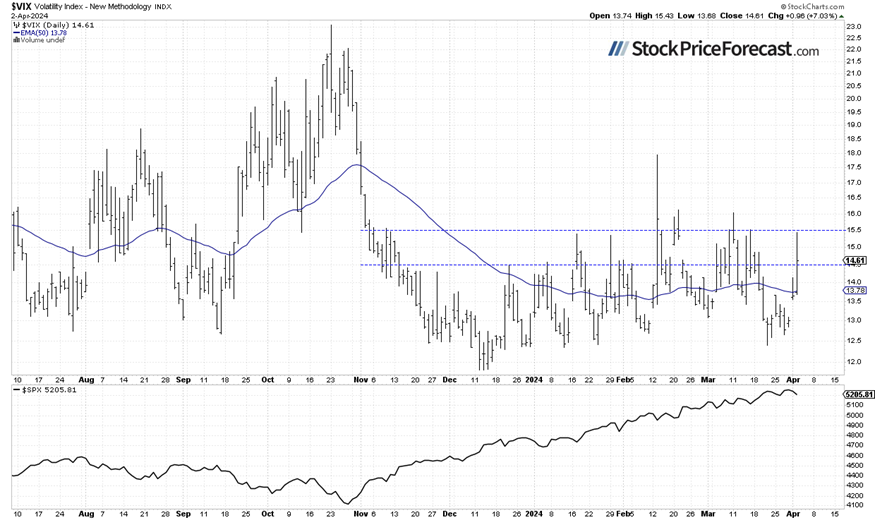
VIX rebounded to 15.50
The VIX index, also known as the fear gauge, is derived from option prices. Last week, it has been trading along the 13 level, and yesterday, it bounced to the 15.50 level as stocks were accelerating their intraday decline.
Historically, a dropping VIX indicates less fear in the market, and rising VIX accompanies stock market downturns. However, the lower the VIX, the higher the probability of the market’s downward reversal.
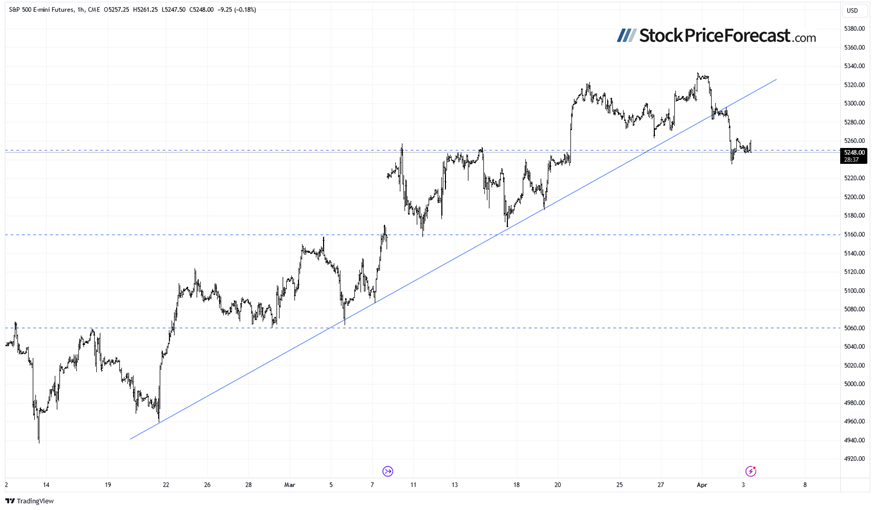
Futures contract - Consolidation following a sell-off
Let’s take a look at the hourly chart of the S&P 500 futures contract. This morning it’s trading within a consolidation following yesterday’s decline. The market broke below last week’s local lows. It remains close to local highs from the early March, which serve as a support.
Conclusion
Wednesday’s trading session is likely to open virtually flat, but the S&P 500 index looks weak following its yesterday’s decline. More pronounced profit-taking action may be in cards at some point. However, as of now, there have been no confirmed negative signals.
Yesterday, I wrote that “In April, we will see a usual series of important economic data, but with the Fed leaning towards easing monetary policy, we should perhaps pay more attention to the quarterly earnings season. However, good earnings may be met with a profit-taking action this time. The market appears to be getting closer to a correction.” So far, it looks like a profit-taking is happening right now. Is this a new downtrend? Likely not, however, a correction towards 5,000-5,100 is possible at some point.
For now, my short-term outlook remains neutral.
Here’s the breakdown:
-
The S&P 500 is likely to fluctuate following its yesterday’s retreat.
-
In the medium term, stock prices are overbought, suggesting the potential for a correction.
-
In my opinion, the short-term outlook is neutral.
The full version of today’s analysis - today’s Stock Trading Alert - is bigger than what you read above, and it includes the additional analysis of the Apple (AAPL) stock and the current S&P 500 futures contract position. I encourage you to subscribe and read the details today. Stocks Trading Alerts are also a part of our Diamond Package that includes Gold Trading Alerts and Oil Trading Alerts.
And if you’re not yet on our free mailing list, I strongly encourage you to join it - you’ll stay up-to-date with our free analyses that will still put you ahead of 99% of investors that don’t have access to this information. Join our free stock newsletter today.
Want free follow-ups to the above article and details not available to 99%+ investors? Sign up to our free newsletter today!
Want free follow-ups to the above article and details not available to 99%+ investors? Sign up to our free newsletter today!
Author

Paul Rejczak
Sunshine Profits
Paul Rejczak is a stock market strategist who has been known for the quality of his technical and fundamental analysis since the late nineties.


