S&P 500 Outlook: Index down for three straight sessions heading into Tuesday
- SPY ETF sees largest outflows in June since January 2015.
- Semiconductors and big tech experience profit-taking after good run.
- Micron releases quarterly earnings on Wednesday.
- Goldman says that traders are selling tech in favor of financials.

The S&P 500 Index might have finally reached a range high as the short-term rally that began on May 31 has finally receded for three sessions in a row.
Though Monday’s 0.31% pullback was minor, the fact that this is taking place at a time when the Index is overbought remains the focus. On Tuesday, June 18, the S&P 500 reached its highest overbought level on the Relative Strength Index (RSI) since December 2023.
The primary economic indicator this week will be Friday’s Personal Consumption Expenditures (PCE) inflation reading. The market expects annual core inflation to drop from 2.8% in April to 2.6% in May, as well as rising just 0.1% on a monthly basis.
S&P 500 news: Nvidia down, Micron earnings ahead
The major index has gained in June, but data shows that investors are beginning to book profits. $27.8 billion has drained out of the SPDR S&P 500 ETF Trust (SPY), the index’s largest ETF, so far in June. About $12 billion of that figure alone came last week.
To put this in perspective, this means it is neck-and-neck with the ETF’s worst month until now, January 2015. That month from nearly a decade ago saw net outflows of $28 billion.
There has been weakness on the semiconductor front of late, which alongside the Magnificent Seven have been leading the indices for most of this year. Market leader Nvidia (NVDA) fell 4% last week and is down another 2% at the time of writing.
"Most subsectors were net sold on the week, led in notional terms by Semis & Semi Equip (SOXX) (SMH) (long sales), Tech Hardware (short sales), and Communications Equipment (long + short sales), which outweighed net buying in Software and IT Services," Goldman analysts wrote in an investor note.
The same investor note said that banks, consumer finance and insurance stocks were getting the most love from its brokerage clients.
Micron Technology (MU) is the focus of the chip space this week as it gears up to report on Wednesday. Expectations are high among analysts as the high-bandwidth memory segment is projected to show heavy growth from artificial intelligence (AI) chip and hardware makers. Additionally, Dynamic Random Access Memory (DRAM) products are forecast to benefit from cyclicality. Citi raised its price target on Micron stock to $175 as shares of the Idaho-based company trade circa $140.
Crowdstrike (CRWD) was added to the S&P 500 index on Monday. The cybersecurity company co-founded and led by George Kurtz went public five years ago, but it took some time for the fast-growing company to become consistently profitable on a GAAP basis, which is a requirement for inclusion in the S&P 500.
Earnings Calendar
Tuesday, June 25 - Baker Hughes (BKR), Carnival (CCL) and FedEx (FDX)
Wednesday, June 26 - General Mills (GIS), Paychex (PAYX), Levi Strauss (LEVI), Micron (MU)
Thursday, June 27 - Nike (NKE), McCormick (MKC), Walgreens Boots Alliance (WBA), Acuity Brands (AYI)
S&P 500 FAQs
The S&P 500 is a widely followed stock price index which measures the performance of 500 publicly owned companies, and is seen as a broad measure of the US stock market. Each company’s influence on the computation of the index is weighted based on market capitalization. This is calculated by multiplying the number of publicly traded shares of the company by the share price. The S&P 500 index has achieved impressive returns – $1.00 invested in 1970 would have yielded a return of almost $192.00 in 2022. The average annual return since its inception in 1957 has been 11.9%.
Companies are selected by committee, unlike some other indexes where they are included based on set rules. Still, they must meet certain eligibility criteria, the most important of which is market capitalization, which must be greater than or equal to $12.7 billion. Other criteria include liquidity, domicile, public float, sector, financial viability, length of time publicly traded, and representation of the industries in the economy of the United States. The nine largest companies in the index account for 27.8% of the market capitalization of the index.
There are a number of ways to trade the S&P 500. Most retail brokers and spread betting platforms allow traders to use Contracts for Difference (CFD) to place bets on the direction of the price. In addition, that can buy into Index, Mutual and Exchange Traded Funds (ETF) that track the price of the S&P 500. The most liquid of the ETFs is State Street Corporation’s SPY. The Chicago Mercantile Exchange (CME) offers futures contracts in the index and the Chicago Board of Options (CMOE) offers options as well as ETFs, inverse ETFs and leveraged ETFs.
Many different factors drive the S&P 500 but mainly it is the aggregate performance of the component companies revealed in their quarterly and annual company earnings reports. US and global macroeconomic data also contributes as it impacts on investor sentiment, which if positive drives gains. The level of interest rates, set by the Federal Reserve (Fed), also influences the S&P 500 as it affects the cost of credit, on which many corporations are heavily reliant. Therefore, inflation can be a major driver as well as other metrics which impact the Fed decisions.
S&P 500 forecast
The S&P 500 continues to trade well above its 30, 100 and 200-day Simple Moving Averages (SMA), which tells us that the index continues to relish its uptrend status. We mention the 30-day SMA here, because the index has been using it for stability in the short term, while the 100-day SMA has been instrumental in heading off pullbacks this year.
Support rests at 5,200 and in the region just below 5,000. The index now sits in the 5,400s as several bullish analysts have projected it will end the year at 5,600 to 6,000. The index is already up 14.5% so far this year.
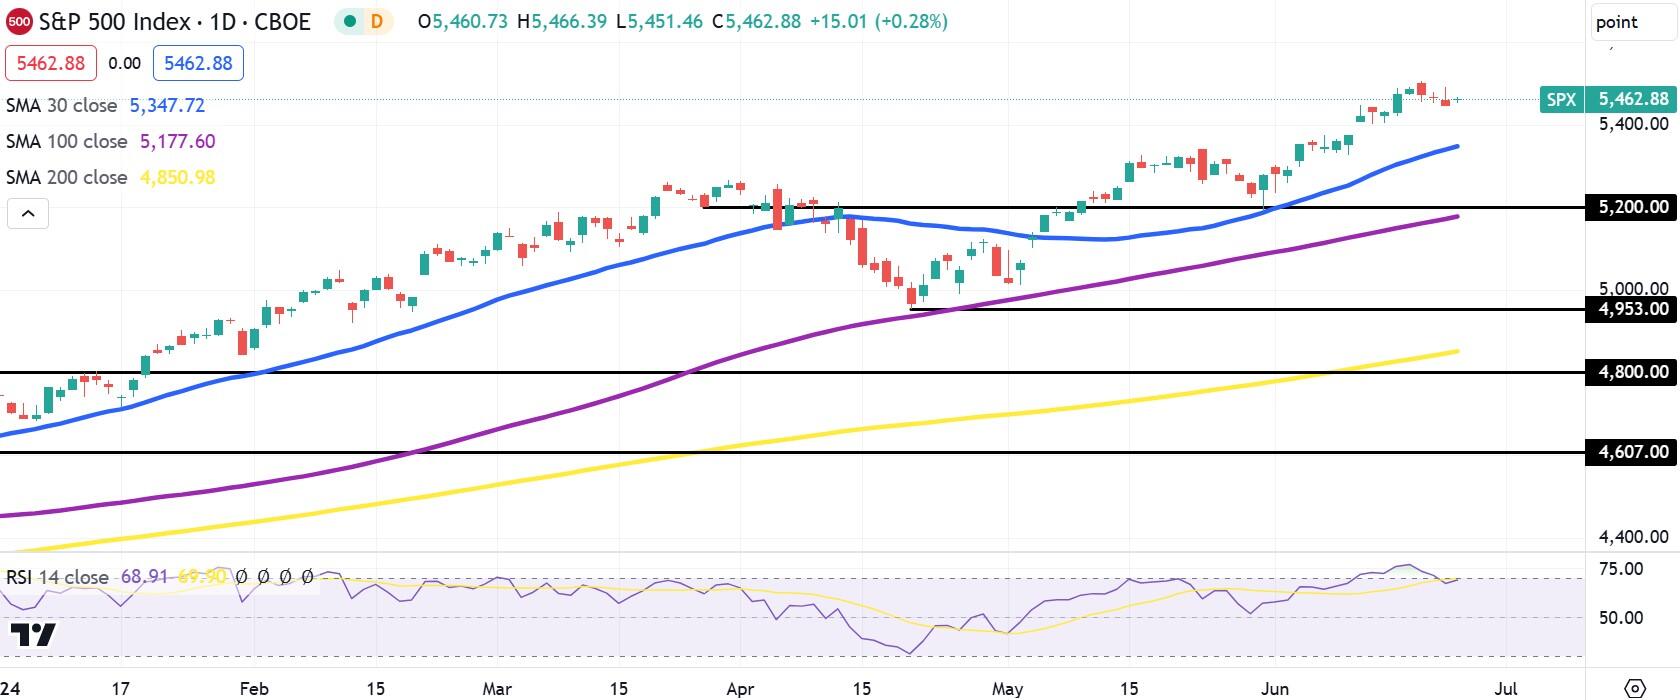
S&P 500 daily chart
Premium
You have reached your limit of 3 free articles for this month.
Start your subscription and get access to all our original articles.
Author

Clay Webster
FXStreet
Clay Webster grew up in the US outside Buffalo, New York and Lancaster, Pennsylvania. He began investing after college following the 2008 financial crisis.


