S&P 500 offers a number of earnings plays this week
- S&P 500 index has retracted 2.8% over the past two weeks.
- One of the biggest earnings weeks for calendar Q2 is upon us.
- Apple, Microsoft, Amazon and Meta Platforms all release this week.
- Federal Reserve will release interest rate decision on Wednesday.

McDonald’s (MCD) was first out the gate on Monday in a week filled with numerous high-profile earnings events. The leading fast food retailer missed earnings and revenue expectations but still managed to tack on a more than 3% share price gain after noting recent success for its $5 Meal deal.
Besides McDonald’s, Microsoft (MSFT), Meta Platforms (META), Apple (AAPL), Amazon (AMZN), Starbucks (SBUX), ExxonMobil (XOM), Intel (INTC) and Merck (MRK) all release quarterly results this week.
Additionally, this week is made more noteworthy by the Federal Reserve’s (Fed) July interest rate decision. Based on the CME Group’s FedWatch Tool, there is only a 5% chance of a rate cut when the central bank delivers its decision on Wednesday.
S&P 500 news: It’s earnings week, baby
The market has been stuck in sell-off mode during the latter half of July, which owes in part to lackluster results from Alphabet (GOOGL) and Tesla (TSLA), as well as to a general pullback from artificial intelligence (AI) plays like Nvidia (NVDA) and Super Micro Computer (SMCI).
Traders are excited to see if the market’s fortunes shift in the right direction this week. Early signs from the Dallas Fed Manufacturing Business Index and McDonald’s results seem to reveal more negativity under the surface however.
Tuesday starts off with Microsoft. The internet and computer powerhouse is expected to earn $2.94 per share on revenue of $64.4 billion. This would mean a 15% gain in top line growth over the past year.
Advanced Micro Devices (AMD), which is focused on its MI300X competitor to Nvidia’s suite of AI chips, is expected to release Tuesday results showing $0.68 in adjusted EPS on $5.7 billion in revenue.
On Wednesday, Meta Platforms is expected to post adjusted EPS of $4.78 on $38.3 billion in revenue. The social media leader has just introduced its largest AI language model yet: the Llama 3.1 405B.
Also on Wednesday, Arm Holdings (ARM) will announce projected earnings of $0.35 per share on $906 million in sales.
Apple arrives on Thursday with consensus for EPS of $1.34 on revenue of $84.37 billion.
Amazon will release simultaneously and is expected to earn $1.01 in adjusted EPS on revenue of $148.6 billion.
Intel, Block (SQ), Roku (ROKU), Coinbase (COIN), DraftKings (DKNG), MercadoLibre (MELI) and Booking Holdings (BKNG) will follow this onslaught on Thursday, which should make that session the most-watched.
Then Friday brings in the oil and gas giants of ExxonMobil and Chevron (CVX).
Market Quote: S&P 500
Deutsche Bank’s Jim Reid suggests that traders will remain a bit placid before the Fed’s interest rate decision on Wednesday and the following presser from Chair Jerome Powell.
"Clearly with the Fed likely to start an easing cycle soon, the FOMC has the potential to be a big event, but the likelihood is that they will simply signal a rate cut which is a reasonable baseline for September without pre-committing. So it may not be hugely market moving.”
S&P 500 FAQs
The S&P 500 is a widely followed stock price index which measures the performance of 500 publicly owned companies, and is seen as a broad measure of the US stock market. Each company’s influence on the computation of the index is weighted based on market capitalization. This is calculated by multiplying the number of publicly traded shares of the company by the share price. The S&P 500 index has achieved impressive returns – $1.00 invested in 1970 would have yielded a return of almost $192.00 in 2022. The average annual return since its inception in 1957 has been 11.9%.
Companies are selected by committee, unlike some other indexes where they are included based on set rules. Still, they must meet certain eligibility criteria, the most important of which is market capitalization, which must be greater than or equal to $12.7 billion. Other criteria include liquidity, domicile, public float, sector, financial viability, length of time publicly traded, and representation of the industries in the economy of the United States. The nine largest companies in the index account for 27.8% of the market capitalization of the index.
There are a number of ways to trade the S&P 500. Most retail brokers and spread betting platforms allow traders to use Contracts for Difference (CFD) to place bets on the direction of the price. In addition, that can buy into Index, Mutual and Exchange Traded Funds (ETF) that track the price of the S&P 500. The most liquid of the ETFs is State Street Corporation’s SPY. The Chicago Mercantile Exchange (CME) offers futures contracts in the index and the Chicago Board of Options (CMOE) offers options as well as ETFs, inverse ETFs and leveraged ETFs.
Many different factors drive the S&P 500 but mainly it is the aggregate performance of the component companies revealed in their quarterly and annual company earnings reports. US and global macroeconomic data also contributes as it impacts on investor sentiment, which if positive drives gains. The level of interest rates, set by the Federal Reserve (Fed), also influences the S&P 500 as it affects the cost of credit, on which many corporations are heavily reliant. Therefore, inflation can be a major driver as well as other metrics which impact the Fed decisions.
S&P 500 stock chart
The S&P 500 index has pulled back since its all-time high achieved on July 16 at 5,669. This is largely unsurprising since the index has been gunning it since April. The Moving Average Convergence Divergence (MACD) indicator is showing a pronounced downtrend.
Last Thursday, support was discovered at 5,390, and recent resistance appears entrenched at 5,490. Three out of the past four sessions witnessed support from the 50-day Simple Moving Average (SMA), but the 20-day and 9-day SMAs hover a bit higher.
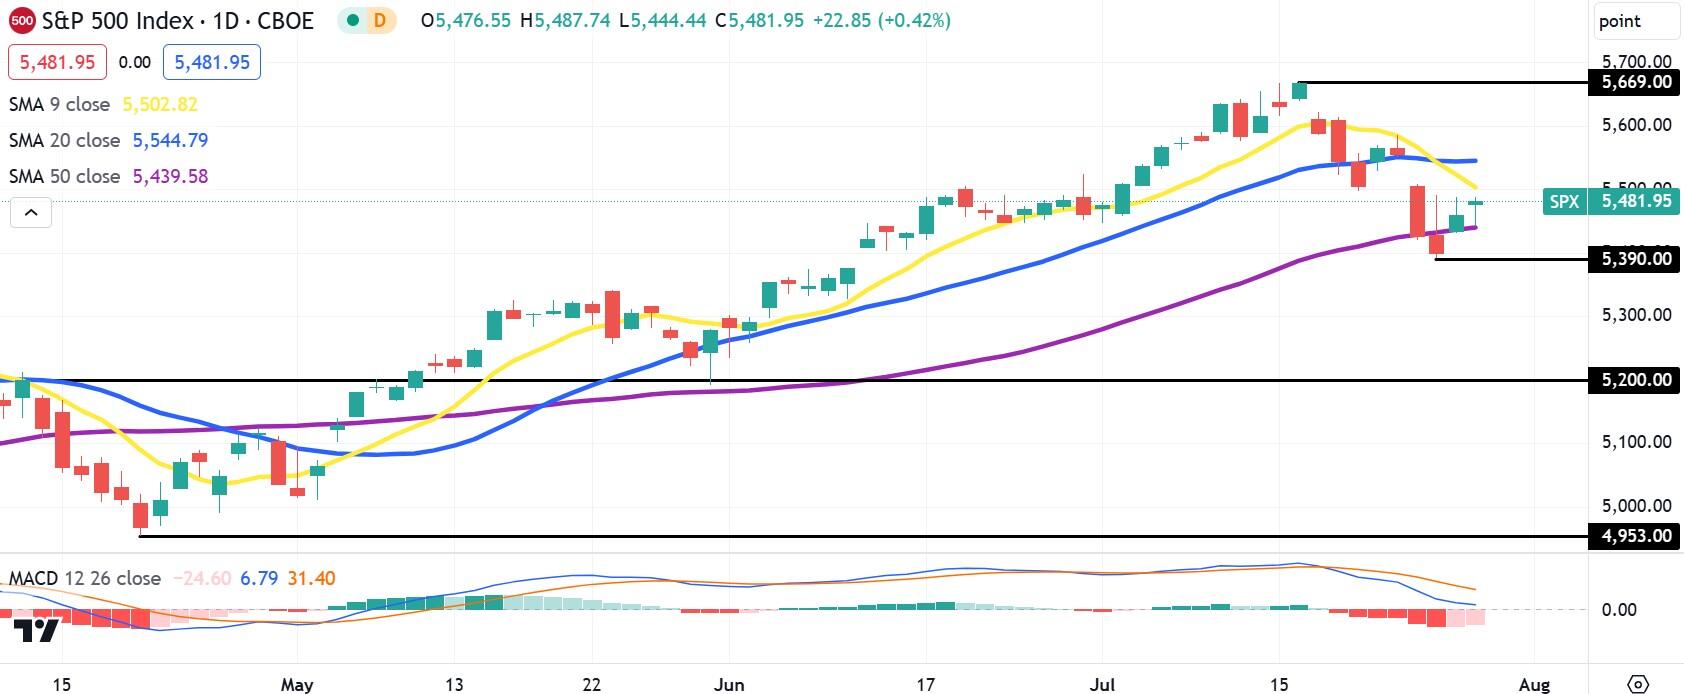
S&P 500 daily index chart
Premium
You have reached your limit of 3 free articles for this month.
Start your subscription and get access to all our original articles.
Author

Clay Webster
FXStreet
Clay Webster grew up in the US outside Buffalo, New York and Lancaster, Pennsylvania. He began investing after college following the 2008 financial crisis.


