Thursday’s trading session brought more volatility for the stock market, with the S&P 500 index reaching a new record high of 5,505.53 but closing 0.25% lower. Today, the index is likely to open 0.2% lower, as indicated by futures contracts. Investors will be waiting for the important U.S. PMI releases at 9:45 a.m.; however, the main event of the day will be the so-called ‘quadruple witching’ later in the day - derivatives contracts expirations that happen once a quarter and are often accompanied by increased volatility.
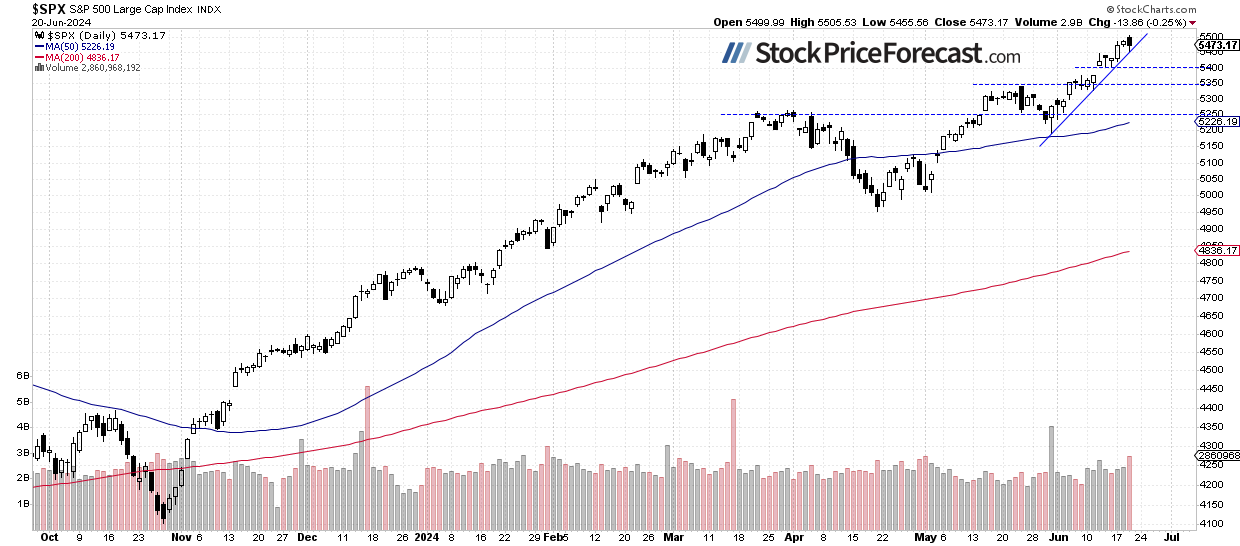
In my forecast for June, I wrote “For the last three months, the S&P 500 index has been fluctuating along new record highs, above the 5,000 level which was broken in February. It looks like a consolidation within a long-term uptrend, but it may also be a topping pattern before some meaningful medium-term correction. What is it likely to do? As the saying goes, 'the trend is your friend', so the most likely scenario is more advances in the future.
However, a negative signal would be a breakdown below the 5,000 level. That would raise the question of a deeper correction and downward reversal. I think that the likelihood of a bullish scenario is 60/40 - a downward reversal cannot be completely ruled out. The market will be waiting for more signals from the Fed about potential interest rate easing, plus, at the end of the month, the coming earnings season may dictate the market moves.”
Investor sentiment remained rather unchanged, as indicated by the AAII Investor Sentiment Survey on Wednesday, which showed that 44.4% of individual investors are bullish, while 22.5% of them are bearish (down from last week's reading of 25.7%). The AAII sentiment is a contrary indicator in the sense that highly bullish readings may suggest excessive complacency and a lack of fear in the market. Conversely, bearish readings are favorable for market upturns.
The S&P 500 index continues to trade above its upward trend line, as we can see on the daily chart.
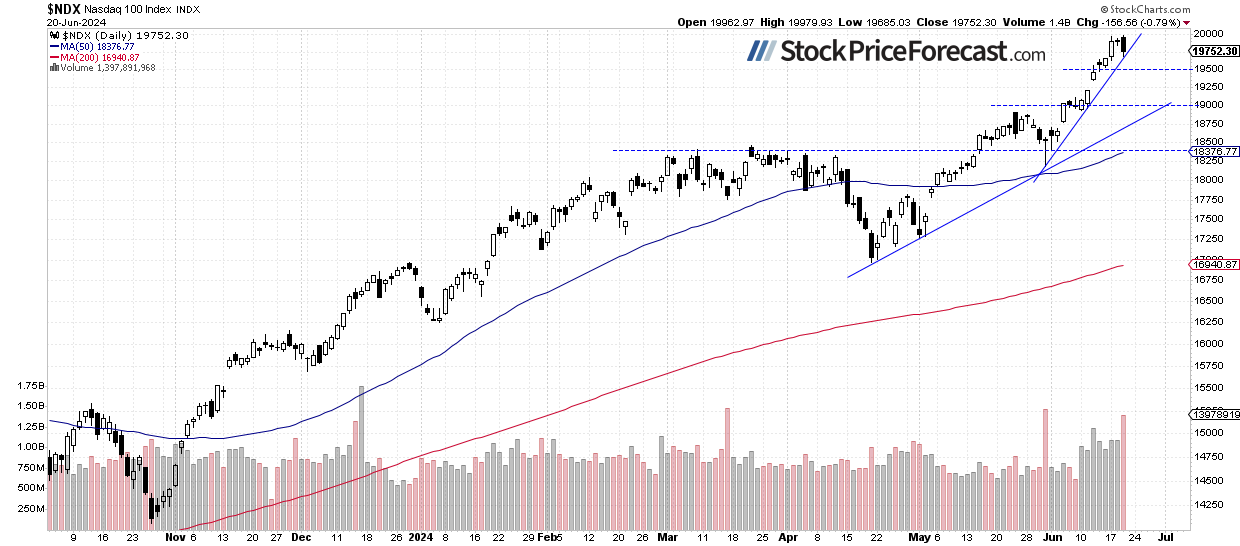
Nasdaq 100 rebounded from 20,000
The technology-focused Nasdaq 100 index reached yet another new record high of 19,979.93 yesterday, before retracing most of its Monday’s advance and closing 0.79% lower. Is this a top? For now, it looks like a correction; however, a breakdown below 19,500 would likely increase selling pressure. This morning, the Nasdaq 100 is likely to open 0.3% lower.
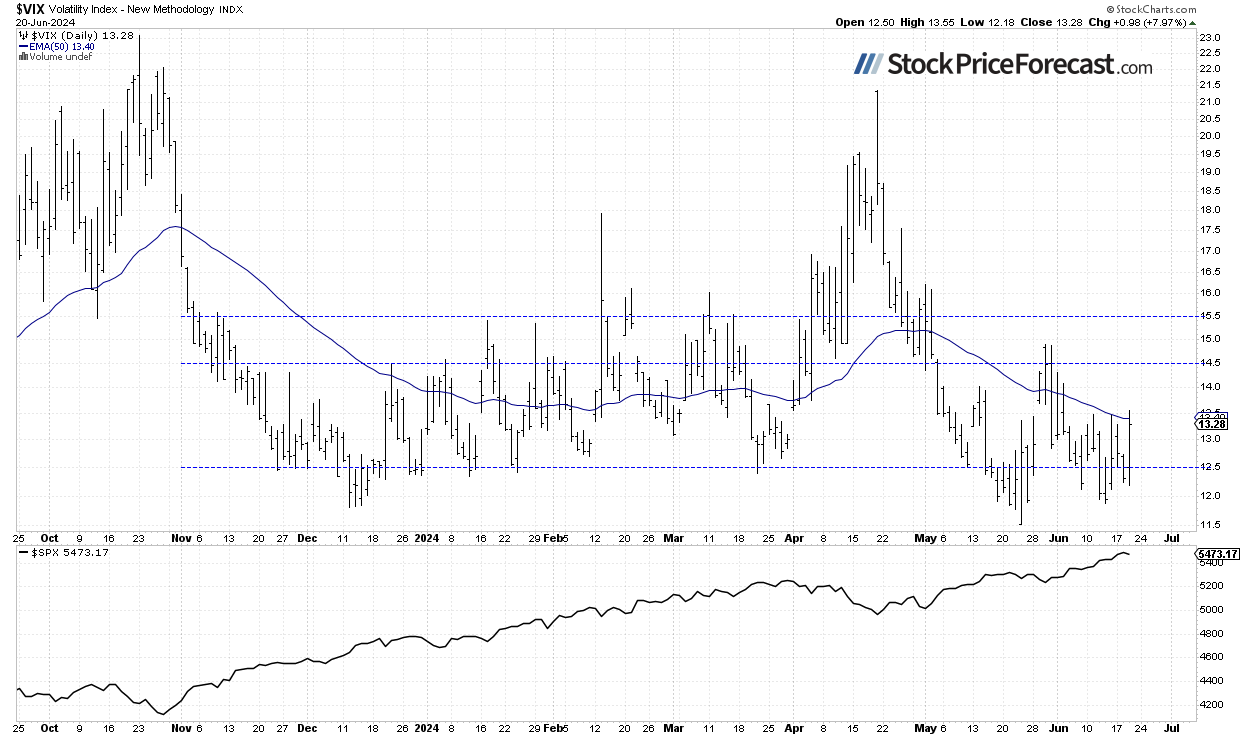
VIX – Above 13 again
The VIX index, also known as the fear gauge, is derived from option prices. In late May, it set a new medium-term low of 11.52 before rebounding up to around 15 on correction worries. Recently, the VIX came back towards 12, and yesterday, it closed above 13 for the first time since early June, showing increasing fear in the market.
Historically, a dropping VIX indicates less fear in the market, and rising VIX accompanies stock market downturns. However, the lower the VIX, the higher the probability of the market’s downward reversal.
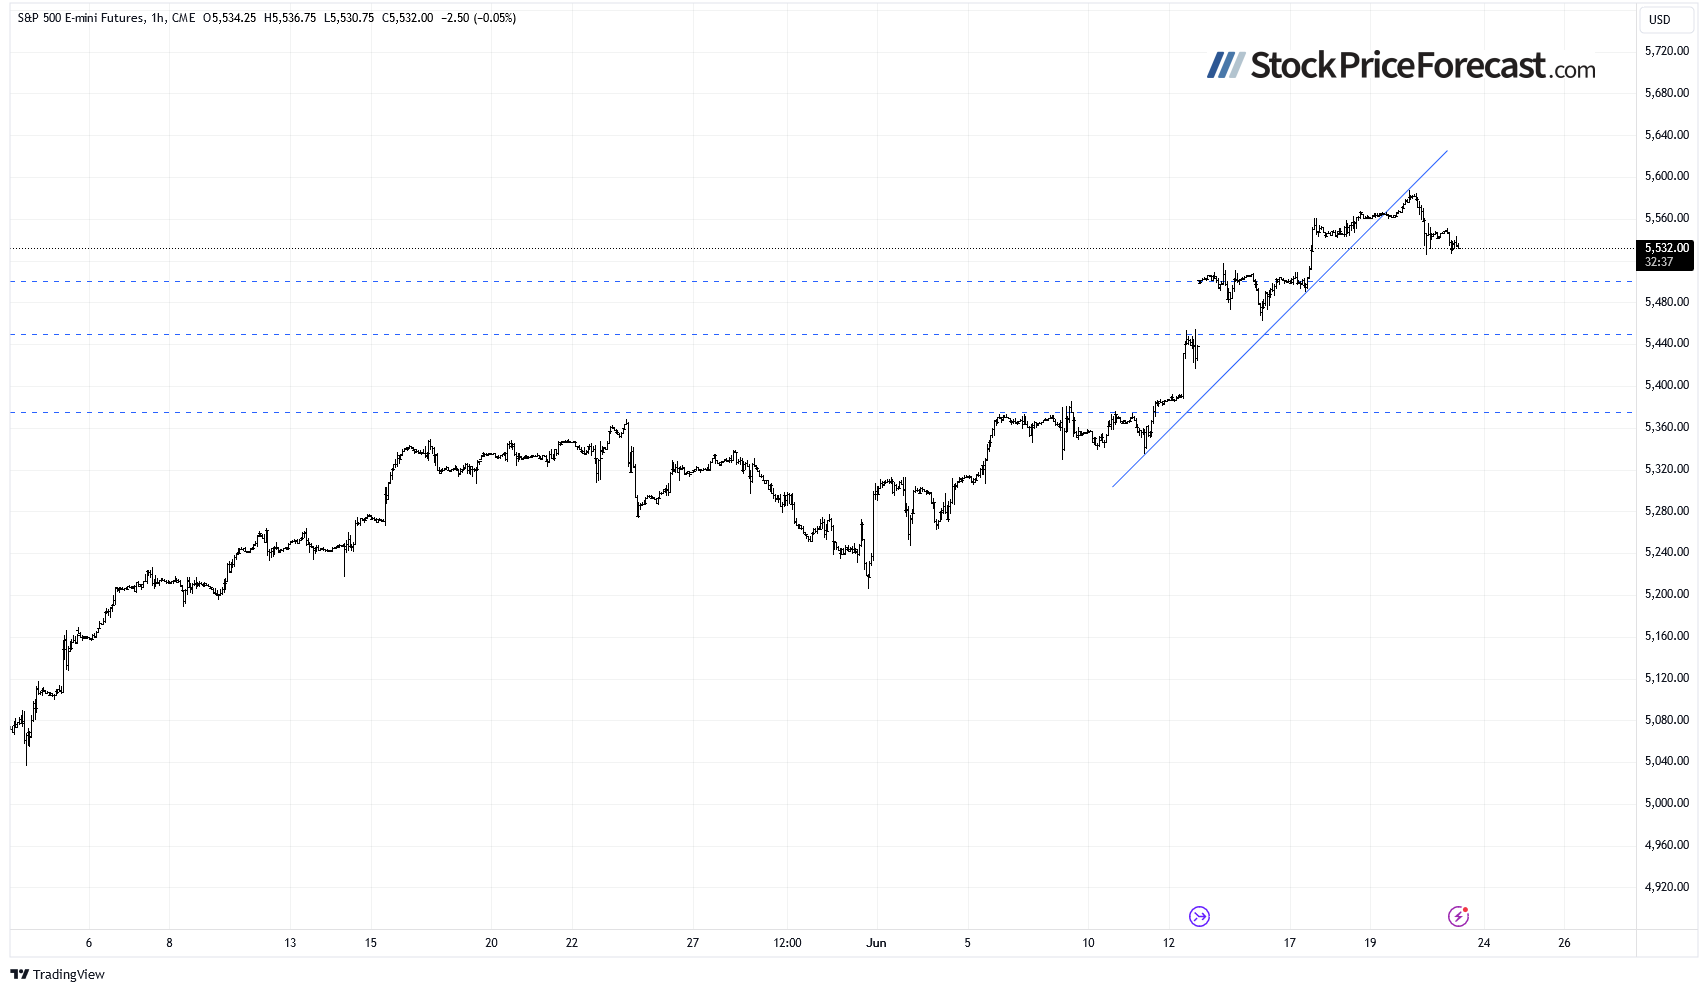
Futures contract – Below 5,550
Let’s take a look at the hourly chart of the S&P 500 futures contract. It retraced some of its recent advances after rebounding from Thursday’s overnight record high of around 5,588. Yesterday, the market reached a local low of 5,525, and this morning, it’s still trading along that support level. The support level is also at around 5,500, marked by the recent local highs.
Conclusion
The S&P 500 index is expected to open slightly lower this morning, and it may see an attempt at extending yesterday’s decline. However, a lot depends on the PMI data after the open and the derivatives expirations later in the day. Overall, the most likely intraday scenario is a volatile consolidation. Has the uptrend reversed yesterday? For now, it looks like a short-term downward correction, but the market may get lower before rebounding.
For now, my short-term outlook remains neutral.
Here’s the breakdown:
-
The S&P 500 reversed lower from a new record high yesterday; for now, it’s a downward correction.
-
Recently, stock prices were reaching new record highs despite mixed data and growing uncertainty.
-
In my opinion, the short-term outlook is neutral.
Want free follow-ups to the above article and details not available to 99%+ investors? Sign up to our free newsletter today!
All essays, research and information found above represent analyses and opinions of Przemyslaw Radomski, CFA and Sunshine Profits' employees and associates only. As such, it may prove wrong and be a subject to change without notice. Opinions and analyses were based on data available to authors of respective essays at the time of writing. Although the information provided above is based on careful research and sources that are believed to be accurate, Przemyslaw Radomski, CFA and his associates do not guarantee the accuracy or thoroughness of the data or information reported. The opinions published above are neither an offer nor a recommendation to purchase or sell any securities. Mr. Radomski is not a Registered Securities Advisor. By reading Przemyslaw Radomski's, CFA reports you fully agree that he will not be held responsible or liable for any decisions you make regarding any information provided in these reports. Investing, trading and speculation in any financial markets may involve high risk of loss. Przemyslaw Radomski, CFA, Sunshine Profits' employees and affiliates as well as members of their families may have a short or long position in any securities, including those mentioned in any of the reports or essays, and may make additional purchases and/or sales of those securities without notice.
Recommended content
Editors’ Picks
Australian Dollar steady as markets asses minor US data
The AUD/USD regained positive traction on Thursday following the overnight pullback from a one-week top. A softer US Dollar and a positive risk tone benefited the Aussie, as well as the Reserve Bank of Australia’s (RBA) hawkish stance.

EUR/USD: Further losses now look at 1.0450
Further strength in the US Dollar kept the price action in the risk-associated assets depressed, sending EUR/USD back to the 1.0460 region for the first time since early October 2023 prior to key releases in the real economy.

Gold faces extra upside near term
Gold extends its bullish momentum further above $2,660 on Thursday. XAU/USD rises for the fourth straight day, sponsored by geopolitical risks stemming from the worsening Russia-Ukraine war. Markets await comments from Fed policymakers.

Ethereum Price Forecast: ETH open interest surge to all-time high after recent price rally
Ethereum (ETH) is trading near $3,350, experiencing an 10% increase on Thursday. This price surge is attributed to strong bullish sentiment among derivatives traders, driving its open interest above $20 billion for the first time.

A new horizon: The economic outlook in a new leadership and policy era
The economic aftershocks of the COVID pandemic, which have dominated the economic landscape over the past few years, are steadily dissipating. These pandemic-induced economic effects are set to be largely supplanted by economic policy changes that are on the horizon in the United States.

Best Forex Brokers with Low Spreads
VERIFIED Low spreads are crucial for reducing trading costs. Explore top Forex brokers offering competitive spreads and high leverage. Compare options for EUR/USD, GBP/USD, USD/JPY, and Gold.