- Tuesday drew the S&P’s rally to a sharp end as risk appetite reverses direction.
- Equities were largely dragged lower by poor showings in tech stocks.
- US data turns red once again, crimping investor confidence.
The Standard & Poor’s (S&P) 500 major equity index closed Tuesday sharply lower after falling just short of making all-time highs in December. Risk appetite reversed course and turned sharply lower to kick off 2024, drawing the S&P’s recent rally to a quick close as investors pulled back on US economic data misses.
US equities closed out 2023 with a stall in the recent stock rally which helped close out the year with firm gains across major indexes, with the S&P etching in a nine-straight-week upside swing before sinking back on Tuesday as overextended market flows pull back.
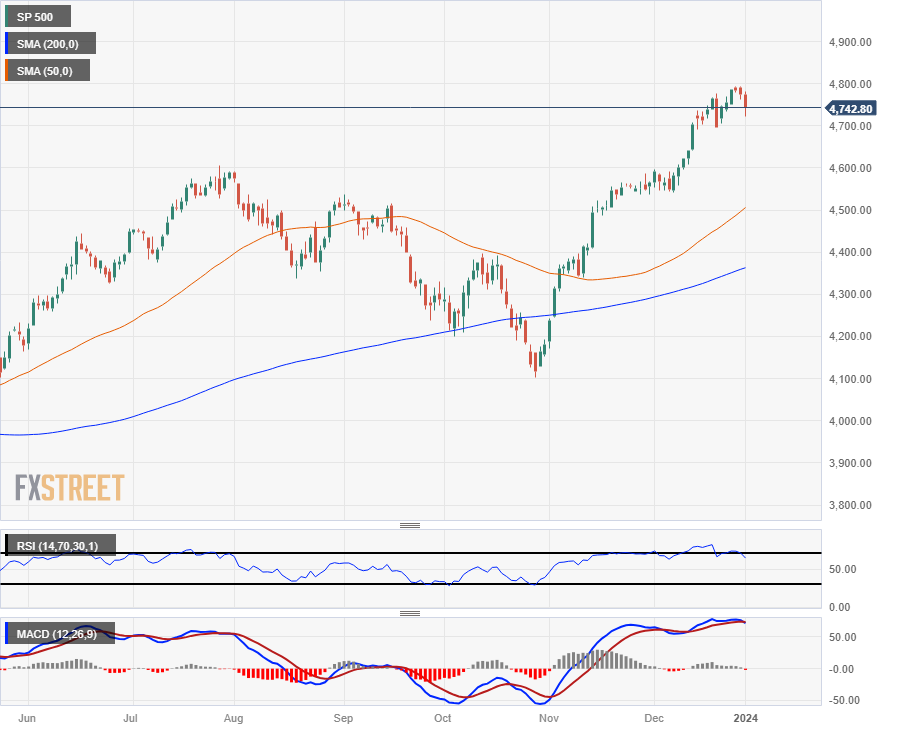
The S&P 500 declined over half of a percent on Tuesday, closing down 27 points at $4,742.83. The tech-heavy NASDAQ saw the largest losses on the day, slipping over 1.6% to close at $14,765.94, down nearly 250 points. The Dow Jones Industrial Average (DJIA) stumped Tuesday’s risk-off flows, closing marginally flat at $37,715.04, rising a scant 0.07% to close 25.5 points higher.
Tech stocks led the charge down the charts as investors pulled back from tech darling Apple (AAPL), which shed 4% on the day following disappointing demand for their latest products, leading Barclay’s to downgrade their outlook on AAPL.
The US S&P Global Manufacturing PMI missed the mark on Tuesday, declining to a four-month low of 47.9 in December versus the market forecast of a steady print of 48.2. Economic data continues to soften in the US, increasing the risk of a “soft landing” economic scenario that threatens to crimp growth and hobble employment, but the Fed will need a bigger push on the inflation front before rates can start coming down.
Wednesday’s US ISM Manufacturing PMI is expected to improve from 46.7 to 47.1 for December, and markets will be keeping a close eye on the Fed’s latest Meeting Minutes due to publish at 19:00 GMT. Investors will be tearing open the Open Market Committee’s latest minutes to try and draw a bead on how steeply Fed policymakers are leaning towards rate cuts, with some particularly eager market participants anticipating the next rate-cutting cycle to begin as soon as March.
2024’s first trading week will wrap up with US Nonfarm Payrolls (NFP), slated for Friday. December’s NFP is expected to show US jobs additions easing back slightly from 199K to 168K.
NFP watchers will first have to survive the midweek hump, with ISM Manufacturing and the Fed’s latest Meeting Minutes releasing on Wednesday, followed by Thursday’s ADP Employment Change and Initial Jobless Claims for the week ending December 29.
S&P 500 Technical Outlook
Despite Tuesday’s bearish 2024 kickoff, the S&P remains firmly entrenched in bull country, trading within reach of fresh all-time-highs beyond $4,814.68, and it would take an 8% decline before the major equity index even reached the 200-day Simple Moving Average (SMA) near $4,363.
$4,600 remains a key technical barrier, providing a technical floor for any extended downturns with the 50-day SMA rising into $4,500 to provide additional technical support.
S&P 500 Daily Chart
S&P 500 Technical Levels
Information on these pages contains forward-looking statements that involve risks and uncertainties. Markets and instruments profiled on this page are for informational purposes only and should not in any way come across as a recommendation to buy or sell in these assets. You should do your own thorough research before making any investment decisions. FXStreet does not in any way guarantee that this information is free from mistakes, errors, or material misstatements. It also does not guarantee that this information is of a timely nature. Investing in Open Markets involves a great deal of risk, including the loss of all or a portion of your investment, as well as emotional distress. All risks, losses and costs associated with investing, including total loss of principal, are your responsibility. The views and opinions expressed in this article are those of the authors and do not necessarily reflect the official policy or position of FXStreet nor its advertisers. The author will not be held responsible for information that is found at the end of links posted on this page.
If not otherwise explicitly mentioned in the body of the article, at the time of writing, the author has no position in any stock mentioned in this article and no business relationship with any company mentioned. The author has not received compensation for writing this article, other than from FXStreet.
FXStreet and the author do not provide personalized recommendations. The author makes no representations as to the accuracy, completeness, or suitability of this information. FXStreet and the author will not be liable for any errors, omissions or any losses, injuries or damages arising from this information and its display or use. Errors and omissions excepted.
The author and FXStreet are not registered investment advisors and nothing in this article is intended to be investment advice.
Recommended content
Editors’ Picks

EUR/USD recovers toward 1.0500 after mixed US PMI data
EUR/USD rebounds toward 1.0500 in the American session on Friday after the data from the US showed that the business activity in the private sector expanded at a softer pace than anticipated in early February. The pair remains on track to end the week with little changed.

GBP/USD rises above 1.2650, looks to post weekly gains
GBP/USD regains its traction and trades above 1.2650 in the second half of the day on Friday. The data from the US showed that the S&P Global Services PMI dropped into the contraction territory below 50 in February, causing the US Dollar to lose strength and helping the pair edge higher.

Gold holds above $2,930 as US yields edge lower
Gold holds above $2,930 after correcting from the record-high it set above $2,950 on Thursday. Following the mixed PMI data from the US, the benchmark 10-year US Treasury bond yield stays in negative territory below 4.5% and allows XAU/USD to hold its ground.

Crypto exchange Bybit hacked for $1.4 billion worth of ETH
Following a security breach first spotted by crypto investigator ZachXBT, crypto exchange Bybit announced that it suffered a hack where an attacker compromised one of its ETH wallets.

Money market outlook 2025: Trends and dynamics in the Eurozone, US, and UK
We delve into the world of money market funds. Distinct dynamics are at play in the US, eurozone, and UK. In the US, repo rates are more attractive, and bills are expected to appreciate. It's also worth noting that the Fed might cut rates more than anticipated, similar to the UK. In the eurozone, unsecured rates remain elevated.

The Best brokers to trade EUR/USD
SPONSORED Discover the top brokers for trading EUR/USD in 2025. Our list features brokers with competitive spreads, fast execution, and powerful platforms. Whether you're a beginner or an expert, find the right partner to navigate the dynamic Forex market.