SP 500 index Elliott Wave technical analysist [Video]
![SP 500 index Elliott Wave technical analysist [Video]](https://editorial.fxstreet.com/images/Markets/Equities/SP500/wall-street-sign-637299022550250958_XtraLarge.jpg)
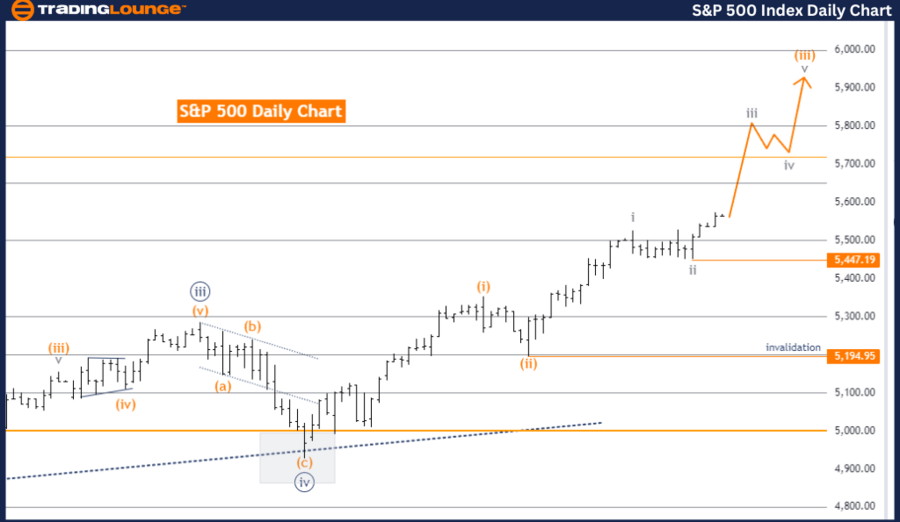
SP 500 Elliott Wave analysis - Daily chart
S&P 500 Elliott Wave Technical Analysis - Daily Chart.
Function: Trend.
Mode: Impulsive.
Structure: Gray Wave 3.
Position: Orange Wave 3.
Direction next lower degrees: Gray Wave 4.
Details: Gray Wave 2 appears completed; now, Gray Wave 3 of Orange Wave 3 is in play. Wave cancel invalid level: 5447.19.
Overview:
The S&P 500 Elliott Wave Analysis on the daily chart focuses on identifying the current market trend. The analysis suggests the trend is impulsive, indicating a strong directional movement and continuation of the trend.
Wave structure:
-
Gray Wave 3: The main structure under observation.
-
Orange Wave 3: The current position within Gray Wave 3.
-
Gray Wave 2: Completed phase that sets up for the current impulsive move.
-
Gray Wave 3 of Orange Wave 3: Indicates a significant and powerful market movement within the larger trend.
Current analysis:
-
Gray Wave 2 Completion: Marks the end of a corrective move and the beginning of a significant impulsive phase.
-
Progression: The market is now in Gray Wave 3 of Orange Wave 3, usually involving a strong, extended movement in line with the overall trend.
Future direction:
-
Gray Wave 4: Expected to form after the completion of the current impulsive wave (Gray Wave 3 of Orange Wave 3), indicating a forthcoming corrective phase.
-
Focus: Remains on the development of Gray Wave 3 of Orange Wave 3.
Wave cancel invalid level:
-
Level: 5447.19
-
Importance: Crossing this level invalidates the current wave structure, requiring a re-evaluation and potential re-labeling of wave counts.
Summary:
The S&P 500 daily chart analysis indicates the market is in an impulsive trend, with Gray Wave 3 unfolding within Orange Wave 3. Gray Wave 2 is complete, and the focus is on the continuation of the impulsive movement in Gray Wave 3 of Orange Wave 3. The wave cancel invalid level is set at 5447.19, highlighting the potential for further upward movement in the S&P 500 index.
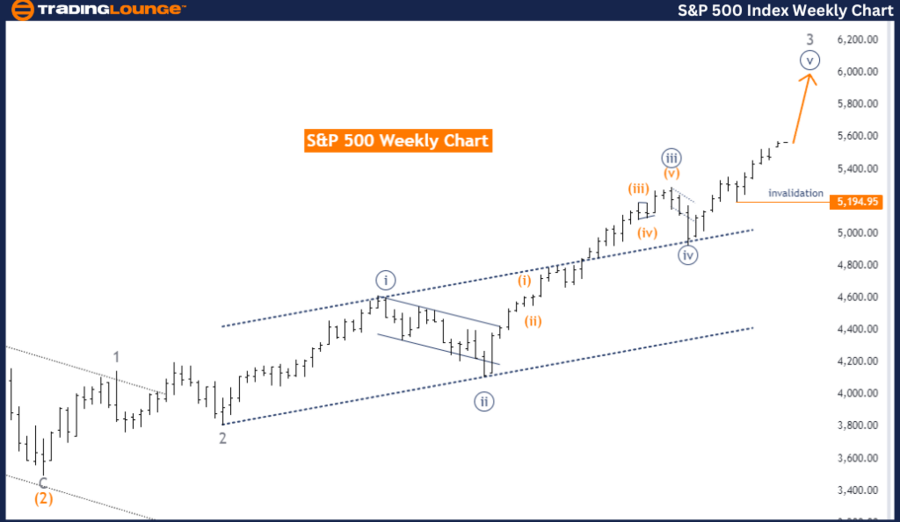
SP 500 Elliott Wave analysis - Weekly chart
S&P 500 Elliott Wave Technical Analysis - Weekly Chart.
Function: Trend.
Mode: Impulsive.
Structure: Navy Blue Wave 5.
Position: Gray Wave 3.
Direction next lower degrees: Navy Blue Wave 5 (continue).
Details: Navy Blue Wave 4 appears completed at 5194.95; Navy Blue Wave 5 is in play. Wave cancel invalid level: 5194.95.
Overview:
The S&P 500 Elliott Wave Analysis on the weekly chart examines the ongoing trend and wave patterns. The current trend is classified as impulsive, indicating strong, clear directional movement in the market.
Wave structure:
-
Navy Blue Wave 5: The main structure under examination, indicating an ongoing upward trend.
-
Gray Wave 3: The current position within Navy Blue Wave 5, suggesting the market is in the third wave of a larger fifth wave.
Current analysis:
-
Navy Blue Wave 4 Completion: Completed at 5194.95, marking a critical transition phase.
-
Progression: The market is now in Navy Blue Wave 5, specifically Gray Wave 3, continuing its upward trajectory.
Future direction:
-
Continuation of Navy Blue Wave 5: Expected to continue as part of the overall impulsive trend.
-
Focus: Remains on the development of Navy Blue Wave 5, provided it stays above the wave cancel invalid level of 5194.95.
Wave cancel invalid level:
-
Level: 5194.95
-
Importance: Crossing this level invalidates the current wave structure, requiring a re-evaluation and potential re-labeling of wave counts.
Summary:
The S&P 500 is currently in an impulsive trend within the Navy Blue Wave 5 structure, with Gray Wave 3 in progress. The completion of Navy Blue Wave 4 indicates a critical transition, leading to the continuation of the upward movement as part of Navy Blue Wave 5. The wave cancel invalid level is set at 5194.95. This analysis provides valuable insights into the ongoing market trend and potential future movements, aiding traders in strategic decision-making and planning.
Technical analyst: Malik Awais.
SP 500 Elliott Wave analysis - Weekly chart [Video]
Author

Peter Mathers
TradingLounge
Peter Mathers started actively trading in 1982. He began his career at Hoei and Shoin, a Japanese futures trading company.


