S&P 500 Index Elliott Wave technical analysis [Video]
![S&P 500 Index Elliott Wave technical analysis [Video]](https://editorial.fxsstatic.com/images/i/Equity-Index_S&P500-1_XtraLarge.jpg)
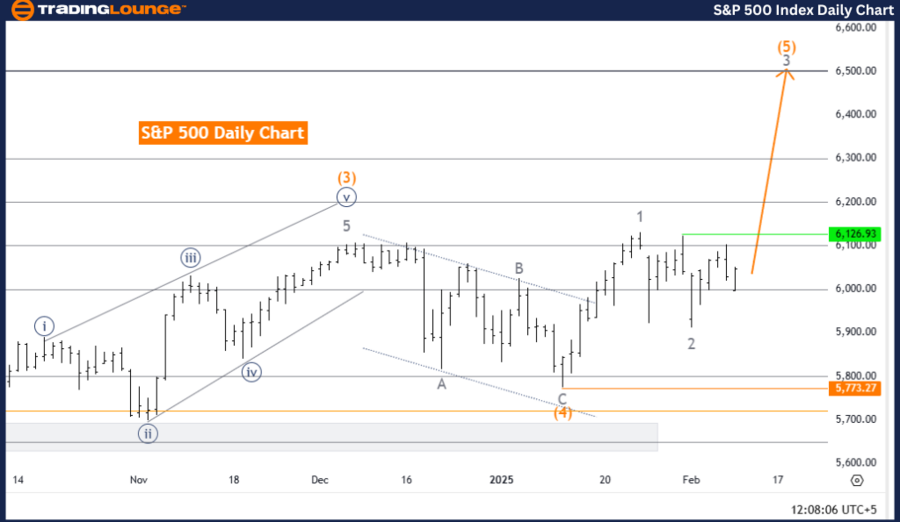
S&P 500 Elliott Wave Analysis - Day Chart.
S&P 500 Elliott Wave technical analysis
-
Function: Bullish Trend.
-
Mode: Impulsive.
-
Structure: Gray Wave 3.
-
Position: Orange Wave 5.
-
Direction next higher degrees: Gray Wave 3 (Started).
-
Details: Gray Wave 2 appears completed; now, Gray Wave 3 is in progress.
-
Wave cancellation invalidation level: 5,773.27.
Analysis overview
The S&P 500 Elliott Wave Analysis for the daily chart indicates a bullish trend, with the current market mode classified as impulsive, reflecting strong upward momentum.
The structure is described as Gray Wave 3, which is part of a larger wave cycle within Orange Wave 5. This suggests that the market is undergoing a significant upward phase, with Gray Wave 3 driving the price higher.
Wave progression and key levels
The analysis suggests that Gray Wave 2, which served as a corrective phase within the broader wave structure, has likely completed. This signals the start of Gray Wave 3, which is expected to push the price further upward.
The next higher degree movement is confirmed as Gray Wave 3, indicating bullish momentum is likely to persist in the near term.
A crucial level to monitor is the Wave Cancellation Invalidation Level at 5,773.27. If the price falls below this level, the current wave count would be invalidated, potentially shifting the bullish outlook. Traders should closely watch this level to confirm trend continuation.
Summary
The S&P 500 Daily Chart Analysis indicates a bullish trend with impulsive momentum, currently in Gray Wave 3 of Orange Wave 5. The completion of Gray Wave 2 has set the stage for further upside movement.
The 5,773.27 level serves as a critical invalidation point, determining whether the bullish trend remains intact. If Gray Wave 3 unfolds as expected, the price is likely to continue rising, reinforcing bullish sentiment in the market.
This analysis provides traders with a clear framework to understand market dynamics and potential price movements.
S&P 500 Elliott Wave Analysis - Weekly Chart.
S&P 500 Elliott Wave technical analysis
-
Function: Bullish Trend.
-
Mode: Impulsive.
-
Structure: Orange Wave 5.
-
Position: Navy Blue Wave 1.
-
Direction next higher degrees: Orange Wave 5 (Started).
-
Details: Orange Wave 4 appears completed; now, Orange Wave 5 is in progress.
-
Wave cancellation invalidation level: 5,773.27.
Analysis overview
The S&P 500 Elliott Wave Analysis for the weekly chart confirms a bullish trend, progressing in impulsive mode. The structure is focused on Orange Wave 5, which is now unfolding after the completion of Orange Wave 4. This suggests a continuation of the upward movement, marking the final stage of the impulsive wave sequence.
The market position within Navy Blue Wave 1 further supports a positive outlook. The initiation of Wave 1 at this level typically indicates the beginning of a sustained uptrend. The progression of Orange Wave 5 suggests strong bullish momentum, characterized by rising price levels and increasing investor confidence.
Wave progression and key levels
The completion of Orange Wave 4 indicates that the market has likely exited a corrective phase, setting the stage for further gains as Orange Wave 5 unfolds. This wave often represents the final and most decisive leg of an impulsive wave cycle, frequently accompanied by high trading activity and strong market enthusiasm.
A key level to monitor is the Wave Cancellation Invalidation Level at 5,773.27. If the price drops below this threshold, the current wave count would be invalidated, requiring a reassessment of the market outlook. Traders should closely track this level to ensure their strategies align with market movements.
Summary
The S&P 500 Weekly Chart Analysis confirms a bullish trend, led by the ongoing development of Orange Wave 5 within Navy Blue Wave 1. The completion of Orange Wave 4 suggests a renewed push higher, offering potential trading opportunities.
Close monitoring of price action near the invalidation level (5,773.27) is essential for accurate market assessment and effective decision-making. If Orange Wave 5 unfolds as expected, the uptrend is likely to persist, reinforcing bullish sentiment in the market.
This analysis provides traders with a clear framework for understanding market dynamics and upcoming price movements.

Technical analyst: Malik Awais.
S&P 500 Elliott Wave technical analysis [Video]
Author

Peter Mathers
TradingLounge
Peter Mathers started actively trading in 1982. He began his career at Hoei and Shoin, a Japanese futures trading company.


