|

SP 500: Impulse is likely to end its pattern at the previous high

The current markup of the SPX500 index shows the continuation of the development of a large impulse consisting of sub-waves I-II-III-IV-V, that is, its final part.

Chart

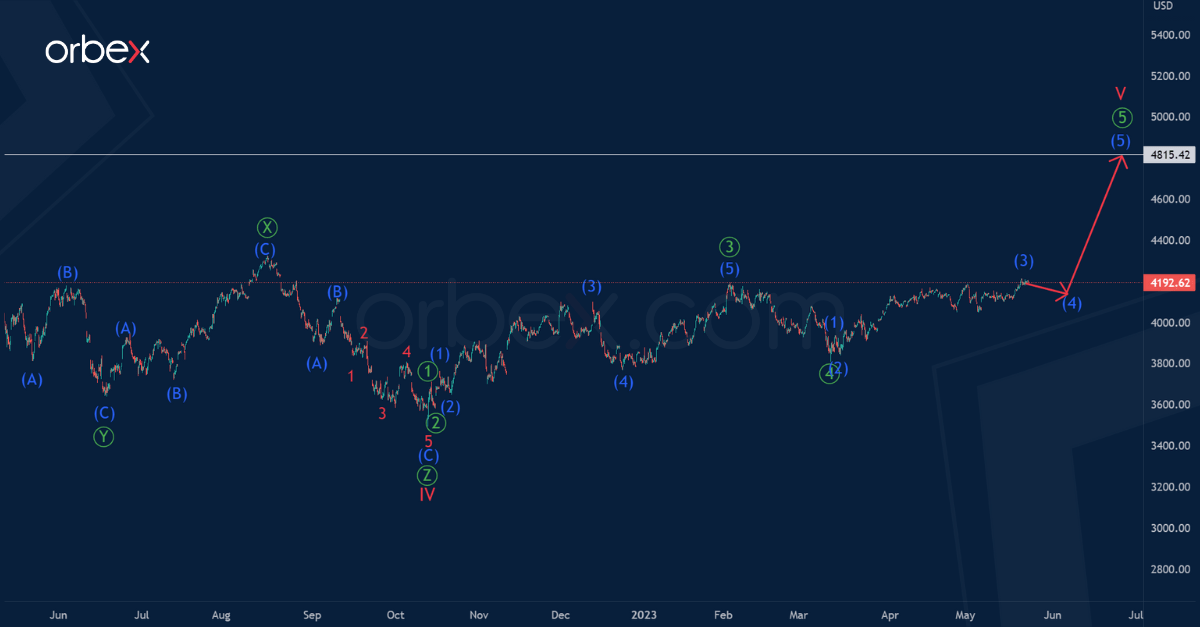
After the cycle correction IV ended in the form of a primary triple zigzag, the price began to climb up, building a cycle fifth wave.

It is assumed that four parts have been completed within the impulse V. In the near future, the market may move up to the maximum of 4815.42, which was marked by the cycle impulse wave III.

Chart

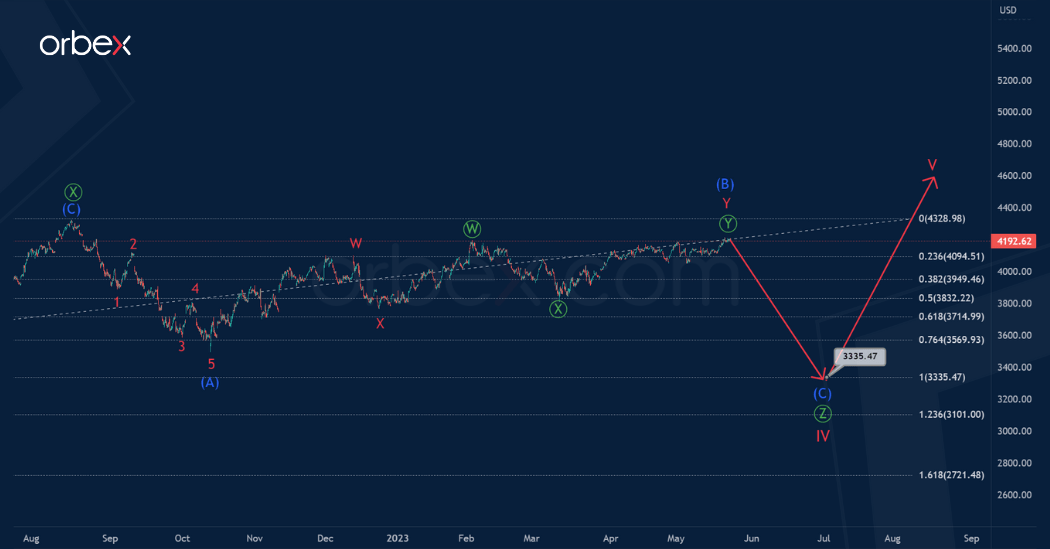
According to the alternative markup, the construction of correction IV can continue. There is a high probability that its actionary wave Ⓩ tends to equality with the wave Ⓨ.

In the near future, the price is expected to fall to the price mark of 3335.47, at which the sub-waves Ⓩ and Ⓨ will be equal to each other.

The intermediate wave (C) can take the form of a simple impulse, or an ending diagonal. It's preferable to add this pair on our watchlist.

Author

Jing Ren

Jing-Ren has extensive experience in currency and commodities trading. He began his career in metal sales and trading at Societe Generale in London.

More from Jing Ren
Share:

Editor's Picks

EUR/USD trims gains, hovers around 1.1900 post-US data

EUR/USD trades slightly on the back foot around the 1.1900 region in a context dominated by the resurgence of some buying interest around the US Dollar on turnaround Tuesday. Looking at the US docket, Retail Sales disappointed expectations in December, while the ADP 4-Week Average came in at 6.5K.

GBP/USD comes under pressure near 1.3680

The better tone in the Greenback hurts the risk-linked complex on Tuesday, prompting GBP/USD to set aside two consecutive days of gains and trade slightly on the defensive below the 1.3700 mark. Investors, in the meantime, keep their attention on key UK data due later in the week.

Gold loses some traction, still above $5,000

Gold faces some selling pressure on Tuesday, surrendering part of its recent two-day advance although managing to keep the trade above the $5,000 mark per troy ounce. The daily pullback in the precious metal comes in response to the modest rebound in the US Dollar, while declining US Treasury yields across the curve seem to limit the downside.

Bitcoin Cash trades lower, risks dead-cat bounce amid bearish signals

Bitcoin Cash trades in the red below $522 at the time of writing on Tuesday, after multiple rejections at key resistance. BCH’s derivatives and on-chain indicators point to growing bearish sentiment and raise the risk of a dead-cat bounce toward lower support levels.

Dollar drops and stocks rally: The week of reckoning for US economic data

Following a sizeable move lower in US technology Stocks last week, we have witnessed a meaningful recovery unfold. The USD Index is in a concerning position; the monthly price continues to hold the south channel support.

Bitcoin Cash trades lower, risks dead-cat bounce amid bearish signals

Bitcoin Cash (BCH) trades in the red below $522 at the time of writing on Tuesday, after multiple rejections at key resistance. BCH’s derivatives and on-chain indicators point to growing bearish sentiment and raise the risk of a dead-cat bounce toward lower support levels.