S&P 500 Forecast: Slow start to week, Fed decision and Instacart IPO key events ahead
- S&P 500's key event is Federal Reserve's interest rate decision on Wednesday.
- US Building Permits, Housing Starts, Existing Home Sales lead week on data front.
- S&P Global Manufacturing & Services PMIs are released on Friday.
- Instacart is expected to IPO on Tuesday at a valuation above $9 billion.

The Standard & Poor's 500 index got off to a slow start on Monday as traders preferred to wait for market-moving events later in the week. The index was barely postive an hour into the first session of the week, while the Dow Jones shed value on the margin, and the NASDAQ Composite advanced just under 0.2%.
The S&P 500 sank for the second week in a row last week as the information technology sector’s 2.2% pullback wiped out the utility sector's 2.7% gain, and caused the index as a whole to slide 0.16% despite a large advance midweek. The S&P 500 is now trading below the 50-day Simple Moving Average and is yet to retest the summer’s July 27 range high.
This week the Federal Reserve’s (Fed) meeting on Wednesday, September 20, is the focus, although the market is almost 100% confident interest rates will remain unchanged. Tuesday’s Instacart initial public offering (IPO) should also boost sentiment if the previous week's Arm Holdings (ARM) IPO success is anything to go by.
A number of other significant economic indicators litter the calendar this week, including Housing Starts, Existing Home Sales and a survey of the US manufacturing and services sectors. NASDAQ 100 futures lead the pack on Monday morning, but all three major US indices are marginally in the black.
S&P 500 News: Fed expected to keep rates fixed at 5.25% to 5.5%
The CME Group’s FedWatch Tool gives the Fed a 99% chance of keeping rates fixed in their current range of between 5.25% and 5.5%. The US Consumer Price Index (CPI) did see headline inflation for August tick higher last week on the back of a surge in Oil and Gasoline prices, but annualized core inflation still managed to fall. The August Producer Price Index (PPI) also showed a worrisome rise in wholesale prices, but the market does not think data is strong enough to change the central bankers’ minds.
Most investors, portfolio managers and traders have concurred that July’s 25 basis point hike was the end of the hiking cycle this year and that the Fed will likely sustain rates at the current nexus for another six months or so until inflation has been truly bested.
The equity market won’t likely move on another rate pause, but stocks could trade up or down depending on how Fed Chair Jerome Powell characterizes the economy, especially labor. Any statement to the effect that the governors of the bank are contemplating further hikes will most certainly send stock prices lower.
Instacart IPO to raise as much as $660 million
Instacart boosted its share price range by $2, from $26 to $28 a share to $28 to $30 a share, last Friday. This will raise approximately $660 million for the digital grocery delivery business and value the company between $9.3 billion and $9.9 billion.
With the company watching how Arm Holdings’s IPO last week was oversubscribed by 10x, it would be unsurprising if the price range moves even higher this week. 2023 has witnessed few significant IPOs year to date, so a successful Instacart IPO will provide more evidence that equity optimism is back.
According to the firm’s S1 filing, Instacart’s Q2 results demonstrated double-digit revenue growth that reached $716 million alongside a net income of $114 million. The IPO, which prices on Monday and begins trading on Tuesday, will see the issuance of 22 million shares with an additional 3.3 million shares available if book runners have the demand.
Heavy focus on housing in this week’s economic indicators
Though many traders are keeping one eye out on Detroit this week – where the Biden administration is attempting to bring the United Auto Workers union to the table with General Motors (GM), Ford (F) and Stellantis (STLA) as the partial strike is in its fourth day – a host of fascinating indices and surveys will be released this week on the US housing market, the manufacturing sector and the services sector.
First, August Building Permits on Tuesday are forecast to arrive at 1.445 million, slightly higher than the previous month. Simultaneously, August Housing Starts data will be released, with the market expecting 1.44 million – slightly below July’s figure.
On Wednesday, Existing Home Sales for August are expected to rise by 30,000 MoM to 4.1 million.
Friday sees the preliminary S&P Global Manufacturing & Services PMI for September come to light. The market expects readings of 47.8 and 50.3, respectively, a tad below August’s readings.
S&P 500 FAQs
What is the S&P 500?
The S&P 500 is a widely followed stock price index which measures the performance of 500 publicly owned companies, and is seen as a broad measure of the US stock market. Each company’s influence on the computation of the index is weighted based on market capitalization. This is calculated by multiplying the number of publicly traded shares of the company by the share price. The S&P 500 index has achieved impressive returns – $1.00 invested in 1970 would have yielded a return of almost $192.00 in 2022. The average annual return since its inception in 1957 has been 11.9%.
How are companies chosen to be included in the S&P 500?
Companies are selected by committee, unlike some other indexes where they are included based on set rules. Still, they must meet certain eligibility criteria, the most important of which is market capitalization, which must be greater than or equal to $12.7 billion. Other criteria include liquidity, domicile, public float, sector, financial viability, length of time publicly traded, and representation of the industries in the economy of the United States. The nine largest companies in the index account for 27.8% of the market capitalization of the index.
How can I trade the S&P 500?
There are a number of ways to trade the S&P 500. Most retail brokers and spread betting platforms allow traders to use Contracts for Difference (CFD) to place bets on the direction of the price. In addition, that can buy into Index, Mutual and Exchange Traded Funds (ETF) that track the price of the S&P 500. The most liquid of the ETFs is State Street Corporation’s SPY. The Chicago Mercantile Exchange (CME) offers futures contracts in the index and the Chicago Board of Options (CMOE) offers options as well as ETFs, inverse ETFs and leveraged ETFs.
What factors drive the S&P 500?
Many different factors drive the S&P 500 but mainly it is the aggregate performance of the component companies revealed in their quarterly and annual company earnings reports. US and global macroeconomic data also contributes as it impacts on investor sentiment, which if positive drives gains. The level of interest rates, set by the Federal Reserve (Fed), also influences the S&P 500 as it affects the cost of credit, on which many corporations are heavily reliant. Therefore, inflation can be a major driver as well as other metrics which impact the Fed decisions.
Earnings of the week
Monday, September 18 - Stitch Fix (SFIX)
Tuesday, September 19 - AutoZone (AZO), Investcorp Credit Management BDC (ICMB)
Wednesday, September 20 - FedEx (FDX), KB Homes (KBH), General Mills (GIS)
Thursday, September 12 - Darden Restaurants (DRI)
What they said about the market – Wells Fargo
News over the weekend leaked that Disney (DIS) CEO Bob Iger has already held preliminary talks with Nexstar Media Group (NXST) to sell ABC. Iger had previously made comments about his interest in monetizing some of Disney’s waning media properties. Wells Fargo analysts think ABC is worth about $4.5 billion. Separately, businessman Byron Allen is said to have offered $10 billion last week to buy ABC and a number of other cable channels from Disney.
"We think investors are in favor of DIS shedding these lower-growth linear assets even though sales multiples would be below DIS at 12x EV/EBITDA."
S&P 500 forecast
The S&P 500 index appears to be in a downtrend since reaching 4,607 on July 27. A top trendline (black) since then shows that the index has sold off on two occasions since retouching that descending trendline – September 1 and September 14.
The index is now trading below the 50-day Simple Moving Average (SMA). With last Friday’s -1.22% performance, odds are that the index could continue lower in search of support. The 100-day SMA is a suitable candidate since it coincides with the lows of August 21 and August 25 near 4,360.
However, if the Instacart IPO goes off as planned or the Fed delivers optimistic chatter on Wednesday, a break of that top trendline will send bulls piling back in to push the index back to the 4,590 to 4,637 resistance range.
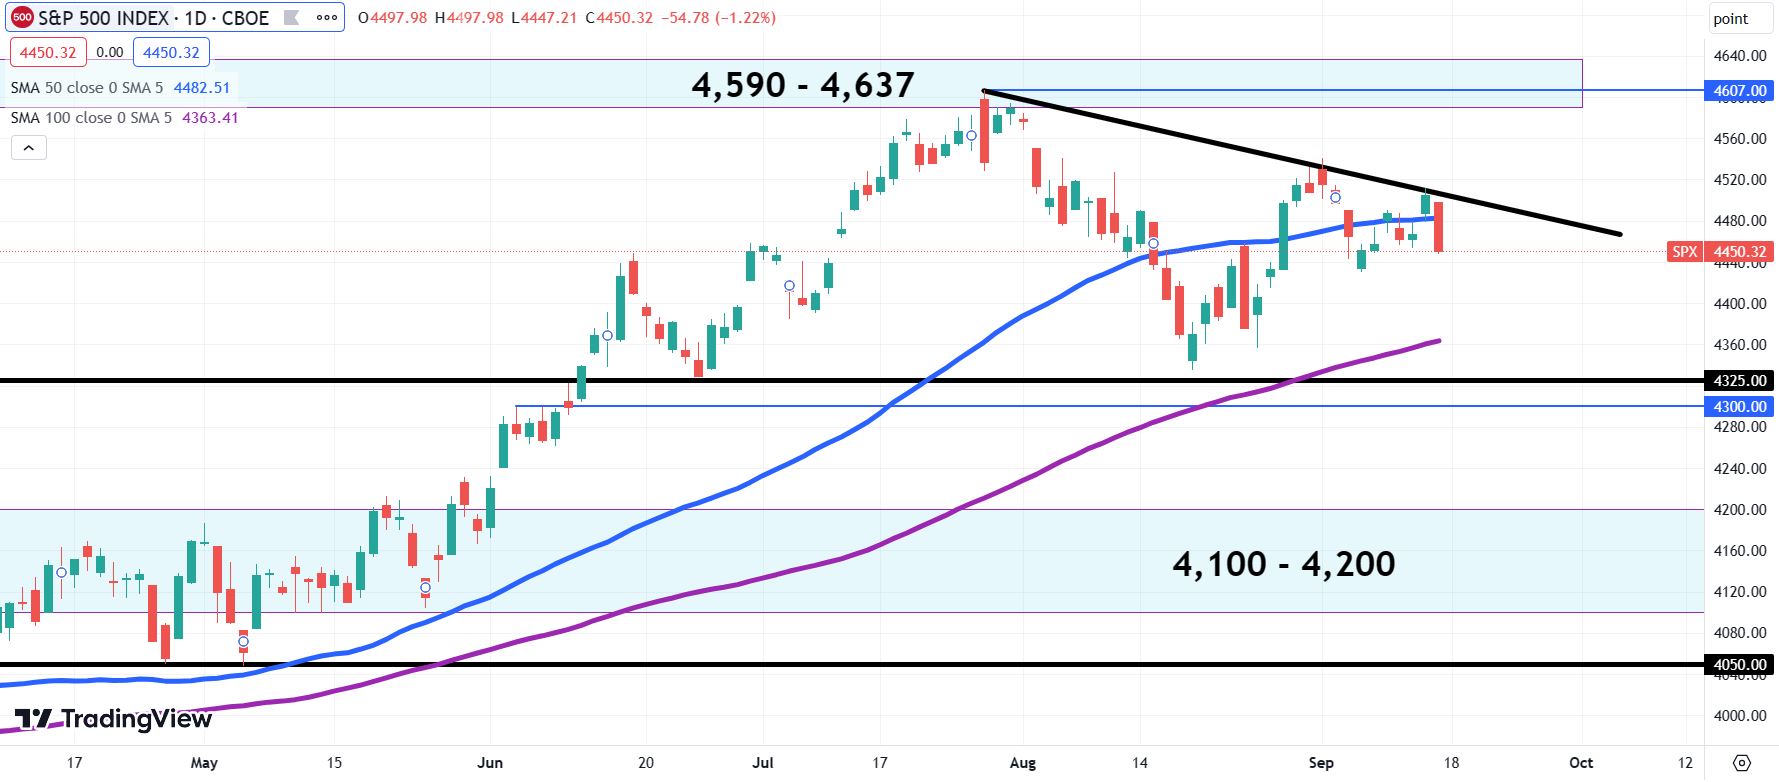
S&P 500 daily chart
Premium
You have reached your limit of 3 free articles for this month.
Start your subscription and get access to all our original articles.
Author

Clay Webster
FXStreet
Clay Webster grew up in the US outside Buffalo, New York and Lancaster, Pennsylvania. He began investing after college following the 2008 financial crisis.


