S&P 500 Elliott Wave technical analysis [Video]
![S&P 500 Elliott Wave technical analysis [Video]](https://editorial.fxstreet.com/images/Markets/Equities/SP500/wall_street_nyse1-637299020939878938_XtraLarge.jpg)
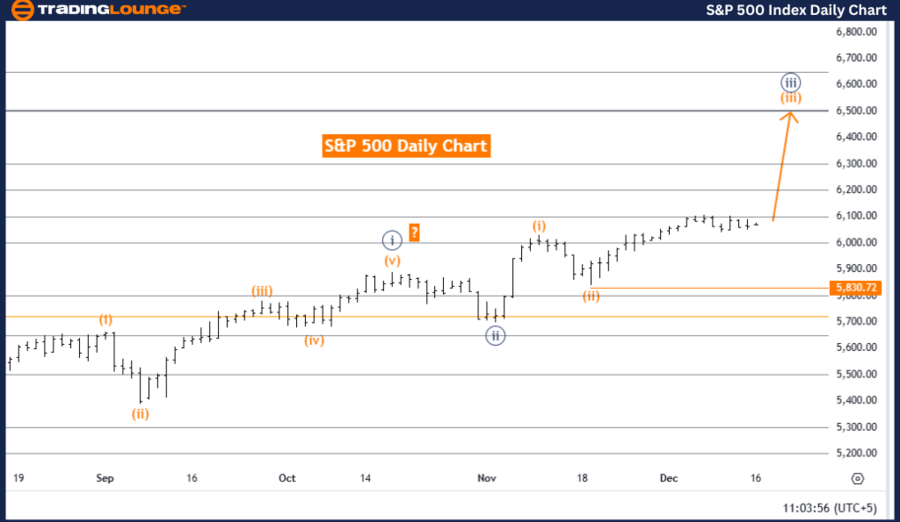
S&P 500 Elliott Wave Analysis - Trading Lounge Day Chart.
S&P 500 Elliott Wave technical analysis
-
Function: Trend.
-
Mode: Impulsive.
-
Structure: Orange Wave 3.
-
Position: Navy Blue Wave 3.
-
Direction next lower degrees: Orange Wave 4.
-
Details: Orange Wave 2 appears completed; currently, Orange Wave 3 of Navy Blue Wave 3 is in progress.
-
Wave cancel invalidation level: 5,830.72.
Analysis overview
The S&P 500 daily chart reveals a bullish trend according to Elliott Wave analysis. The wave mode is impulsive, signifying strong upward momentum driven by robust buying interest. The current wave structure is Orange Wave 3, actively developing within Navy Blue Wave 3, signaling continued upward movement.
The analysis indicates that Orange Wave 2 has been completed, initiating the progression of Orange Wave 3 within Navy Blue Wave 3. This phase often represents a powerful and sustained bullish move, with heightened market activity and increasing bullish sentiment. The ongoing development of Orange Wave 3 sets the primary direction of the market.
Next phases and market outlook
Once Orange Wave 3 concludes, Orange Wave 4 is anticipated as the next phase in the cycle. However, the immediate focus remains on the progression of Orange Wave 3, which continues to dominate market behavior with bullish momentum.
Key levels to monitor
The critical invalidation level for this wave structure is identified at 5,830.72. A price movement below this level would invalidate the current wave count and require a reevaluation of the Elliott Wave framework. This level serves as a vital reference point for traders to manage risk and validate the trend effectively.
Conclusion
The S&P 500 daily chart underscores a strong bullish trend, with Orange Wave 3 actively propelling the market higher. The completion of Orange Wave 2 and the progression of Orange Wave 3 within Navy Blue Wave 3 affirm the prevailing upward momentum. Traders should align their strategies with this bullish trend while closely monitoring the invalidation level (5,830.72) to guard against unexpected reversals.
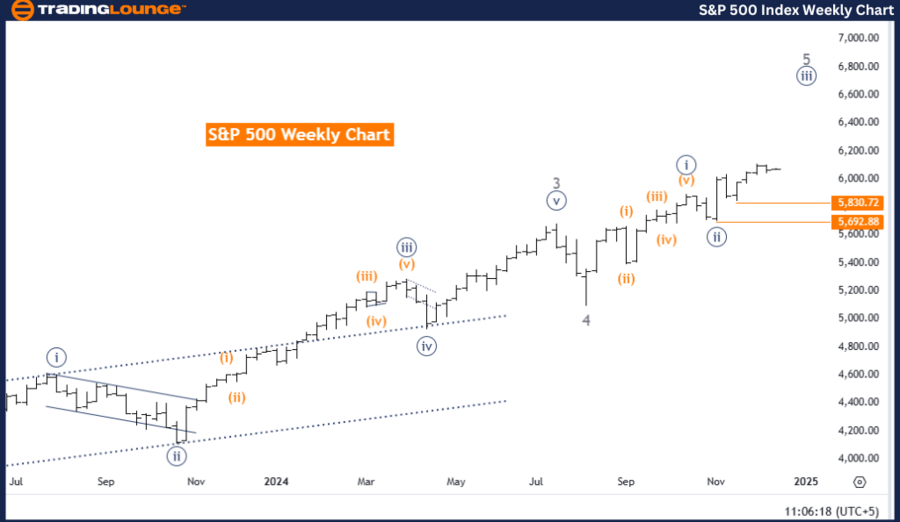
S&P 500 Elliott Wave Analysis - Trading Lounge Weekly Chart.
S&P 500 Elliott Wave technical analysis
-
Function: Trend.
-
Mode: Impulsive.
-
Structure: Navy Blue Wave 3.
-
Position: Gray Wave 3.
-
Direction next lower degrees: Navy Blue Wave 4.
-
Details: Navy Blue Wave 2 appears completed; Navy Blue Wave 3 of 3 is now in play.
-
Wave cancel invalidation level: 5,830.72.
Analysis overview
The S&P 500 weekly chart highlights a strong bullish trend based on Elliott Wave analysis. The wave mode is impulsive, indicating sustained upward momentum. The ongoing wave structure, Navy Blue Wave 3, is actively unfolding within the broader trend framework, suggesting continued upward movement driven by investor confidence.
The analysis confirms that Navy Blue Wave 2 has been completed, paving the way for Navy Blue Wave 3 of 3 to progress. This phase typically represents a powerful and sustained bullish surge, reflecting dominant market sentiment and active participation from buyers. The continued development of Navy Blue Wave 3 signals robust upward momentum.
Next phases and market outlook
Once Navy Blue Wave 3 concludes, the market is expected to transition into Navy Blue Wave 4, which is likely to involve a corrective phase. However, the immediate focus remains on the unfolding of Navy Blue Wave 3, as it drives the current bullish momentum.
Key levels to monitor
The critical invalidation level for this wave structure is established at 5,830.72. A movement below this threshold would invalidate the current wave count, necessitating a reassessment of the Elliott Wave framework. This level serves as a crucial reference point for risk management and trend confirmation.
Conclusion
The S&P 500 weekly chart demonstrates a robust bullish trend, with Navy Blue Wave 3 actively propelling the market higher. The completion of Navy Blue Wave 2 and the ongoing development of Navy Blue Wave 3 affirm the market’s strength and upward trajectory. Traders are encouraged to align their strategies with this prevailing bullish sentiment while monitoring the invalidation level (5,830.72) to effectively manage risks and adapt to potential reversals.
S&P 500 Elliott Wave technical analysis [Video]
Author

Peter Mathers
TradingLounge
Peter Mathers started actively trading in 1982. He began his career at Hoei and Shoin, a Japanese futures trading company.


