S&P 500 Elliott Wave technical analysis [Video]
![S&P 500 Elliott Wave technical analysis [Video]](https://editorial.fxstreet.com/images/Markets/Equities/SP500/wall_street_nyse2-637299021353183737_XtraLarge.jpg)
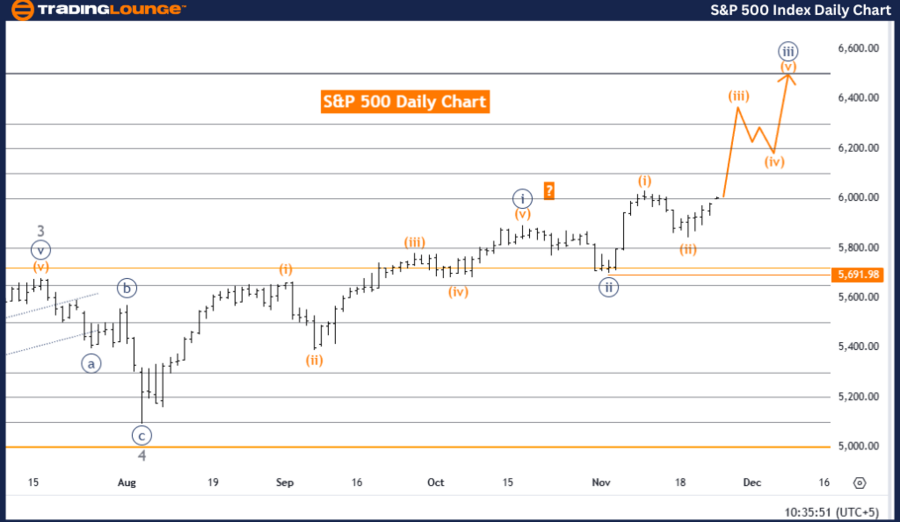
S&P 500 Elliott Wave Analysis Trading Lounge Day Chart.
S&P 500 Elliott Wave technical analysis
-
Function: Bullish Trend.
-
Mode: Impulsive.
-
Structure: Orange wave 3.
-
Position: Navy Blue Wave 3.
-
Next lower degree direction: Orange wave 4.
Details:
-
Orange wave 2 appears complete, with orange wave 3 of navy blue wave 3 now in progress.
-
Invalidation Level: 5,691.98.
Analysis summary
This analysis evaluates the S&P 500 index using Elliott Wave theory on a daily chart, highlighting a bullish trend. The market is currently in impulsive mode, signifying strong upward momentum.
Key points:
-
The primary structure under observation is orange wave 3, initiated after the completion of orange wave 2, marking a continuation of the bullish movement.
-
The market is positioned within navy blue wave 3, and orange wave 3 of this larger wave is unfolding, representing a robust upward phase.
-
The next anticipated development in the lower-degree structure is orange wave 4, a corrective wave expected to follow orange wave 3.
Critical benchmark for validation
The analysis sets an invalidation level of 5,691.98. If the index falls to this level, the current wave count and bullish outlook will be invalidated. This level is crucial for risk management and trend validation.
Conclusion
The Elliott Wave analysis indicates the S&P 500 is in a bullish phase, with orange wave 3 within navy blue wave 3 driving the upward movement. The completion of orange wave 2 confirms the start of this impulsive phase, and the strong momentum suggests further upside potential. The bullish trend remains valid as long as the index stays above the invalidation level of 5,691.98. This analysis projects continued gains before transitioning to the corrective phase in orange wave 4.
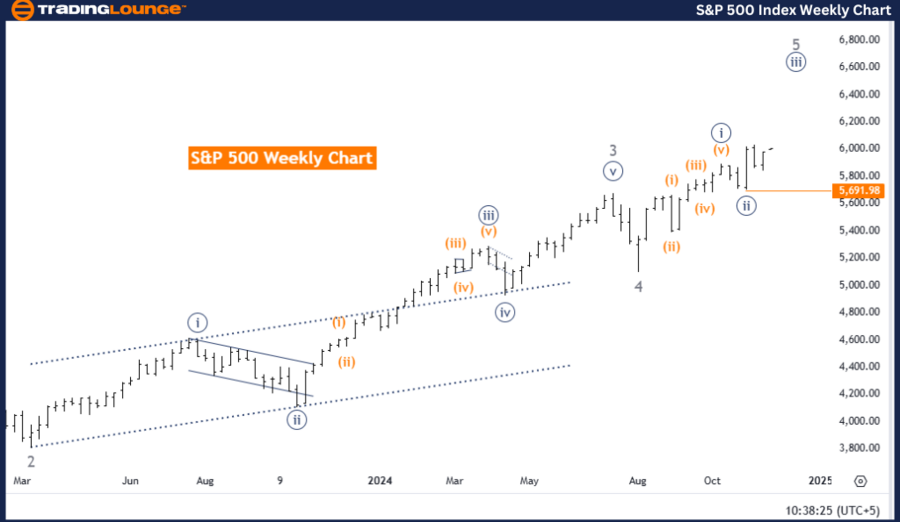
S&P 500 Elliott Wave Analysis Trading Lounge Weekly Chart
S&P 500 Elliott Wave technical analysis
-
Function: Bullish Trend.
-
Mode: Impulsive.
-
Structure: Navy Blue Wave 3.
-
Position: Gray wave 5.
-
Next lower degree direction: Navy blue wave 4.
Details:
-
Navy blue wave 2 appears completed, with navy blue wave 3 of gray wave 5 now unfolding.
-
Invalidation Level: 5,691.98
Analysis summary
This analysis evaluates the S&P 500 index using Elliott Wave theory on a weekly chart, highlighting a bullish trend. The market is currently in impulsive mode, reflecting sustained upward momentum.
Key points:
-
The primary structure under observation is Navy Blue Wave 3, which commenced after the completion of Navy Blue Wave 2, signaling the continuation of a long-term bullish trend.
-
The market is positioned within gray wave 5, the final upward thrust in this impulsive phase.
-
The next anticipated move in the lower-degree structure is navy blue wave 4, a corrective phase expected to follow navy blue wave 3.
Critical benchmark for validation
An invalidation level of 5,691.98 is specified. If the index falls to this level, the current wave count and bullish outlook will be invalidated. This benchmark is essential for managing risks and confirming the ongoing trend.
Conclusion
The Elliott Wave analysis suggests the S&P 500 is in a bullish phase, with navy blue wave 3 within gray wave 5 driving the upward movement. The completion of navy blue wave 2 confirms the start of this impulsive trend, and the current momentum supports further gains. The bullish outlook remains intact as long as the index stays above the invalidation level of 5,691.98. Traders can expect continued upside potential before transitioning to the corrective phase in navy blue wave 4.
Technical analyst: Malik Awais.
S&P 500 Elliott Wave technical analysis [Video]
Author

Peter Mathers
TradingLounge
Peter Mathers started actively trading in 1982. He began his career at Hoei and Shoin, a Japanese futures trading company.


