S&P 500 Elliott Wave technical analysis [Video]
![S&P 500 Elliott Wave technical analysis [Video]](https://editorial.fxstreet.com/images/Markets/Equities/SP500/wall_street_nyse4-637299025173341169_XtraLarge.jpg)
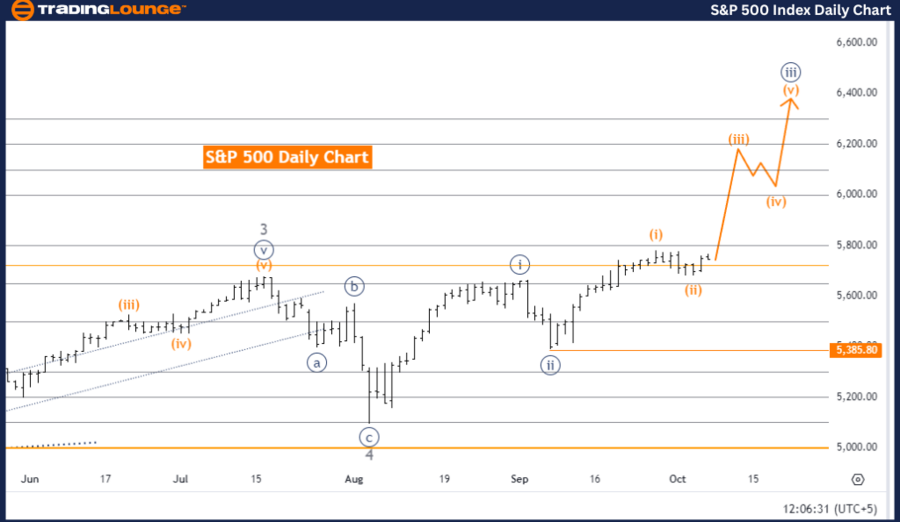
S&P 500 Elliott Wave Analysis Trading Lounge Day Chart,
S&P 500 Elliott Wave technical analysis
Function: Trend.
Mode: Impulsive.
Structure: Orange Wave 3.
Position: Navy Blue Wave 3.
Direction next lower degrees: Orange Wave 4.
Details: Orange wave 2 appears completed, with orange wave 3 now active.
Wave cancel invalidation level: 5,385.80.
The S&P 500 Elliott Wave Analysis for the daily chart reveals that the market is currently in a strong trend phase, progressing impulsively. The active structure under analysis is orange wave 3, indicating an upward movement aligned with the larger trend. The wave is positioned within navy blue wave 3, which further confirms the ongoing impulsive movement within the broader wave structure.
Orange wave 2 is considered complete, signifying the end of the corrective phase that followed the initial upward wave. Now, the market has entered orange wave 3, typically one of the strongest and longest phases in the Elliott Wave cycle. This wave suggests that the upward trend is gaining strength, with price increases anticipated as the wave continues to unfold.
The next projected development is the transition into orange wave 4 once orange wave 3 reaches its peak. Wave 4 generally involves a corrective phase, meaning the market could experience a temporary pullback following the strong upward push of wave 3. However, wave 4 is not yet in play, as the market is still advancing in orange wave 3.
The key invalidation level for this Elliott Wave structure is 5,385.80. Should the market drop below this level, the current wave count would be invalidated, requiring a reassessment of the structure. This level is essential for confirming the ongoing upward trend.
Summary:
The S&P 500 Elliott Wave Analysis shows that the market is in a bullish impulsive trend, with orange wave 3 currently progressing after the completion of orange wave 2. The next phase is expected to be orange wave 4, which will likely bring a corrective movement. The invalidation level is set at 5,385.80, acting as a critical point to verify the trend's continuation.
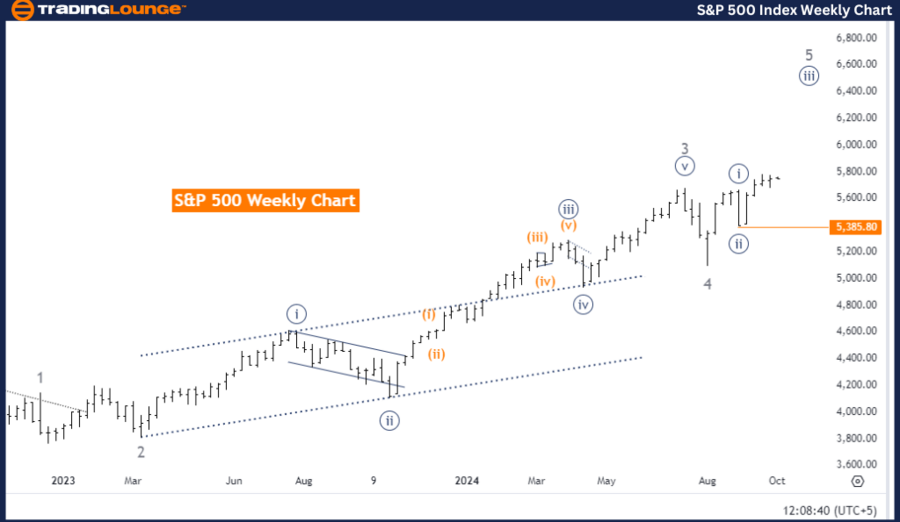
S&P 500 Elliott Wave Analysis Trading Lounge weekly chart.
S&P 500 Elliott Wave technical analysis
Function: Trend.
Mode: Impulsive.
Structure: Navy Blue Wave 3.
Position: Gray Wave 5.
Direction next lower degrees: Navy Blue Wave 4.
DETAILS: Navy blue wave 2 appears completed, with navy blue wave 3 now in play.
Wave cancel invalidation level: 5,385.80.
The S&P 500 Elliott Wave Analysis for the weekly chart reveals that the market is currently following a strong upward trend, moving in an impulsive wave pattern. The main structure being analyzed is navy blue wave 3, which signifies a significant upward movement within the overall trend. The current position is gray wave 5, reflecting the continuation of the impulsive wave within the broader Elliott Wave structure.
Navy blue wave 2 is considered complete, marking the end of the corrective phase and setting the stage for the ongoing impulsive upward movement. Now, navy blue wave 3 is in progress, typically the strongest wave in the Elliott Wave cycle. This wave is expected to drive further market increases, indicating strong bullish momentum.
Once navy blue wave 3 reaches completion, the market is expected to transition into navy blue wave 4. This phase will likely introduce a corrective movement as part of the larger wave pattern. However, for now, navy blue wave 3 remains in play, showing that the market is still in a strong upward phase.
The invalidation level for this Elliott Wave structure is 5,385.80. If the market were to drop below this level, the current wave count would be invalidated, requiring a reassessment of the analysis. This level is crucial for confirming the wave structure and the ongoing trend.
Summary
The S&P 500 Elliott Wave Analysis on the weekly chart shows the market in an impulsive upward trend, with navy blue wave 3 currently active following the completion of navy blue wave 2. The upward movement is expected to continue until navy blue wave 3 concludes, after which navy blue wave 4 may bring a corrective phase. The invalidation level is set at 5,385.80, a key point for validating the current wave structure.
S&P 500 Elliott Wave technical analysis [Video]
Author

Peter Mathers
TradingLounge
Peter Mathers started actively trading in 1982. He began his career at Hoei and Shoin, a Japanese futures trading company.


