S&P 500 Elliott Wave technical analysis [Video]
![S&P 500 Elliott Wave technical analysis [Video]](https://editorial.fxstreet.com/images/Markets/Equities/SP500/wall_street_nyse4-637299025173341169_XtraLarge.jpg)
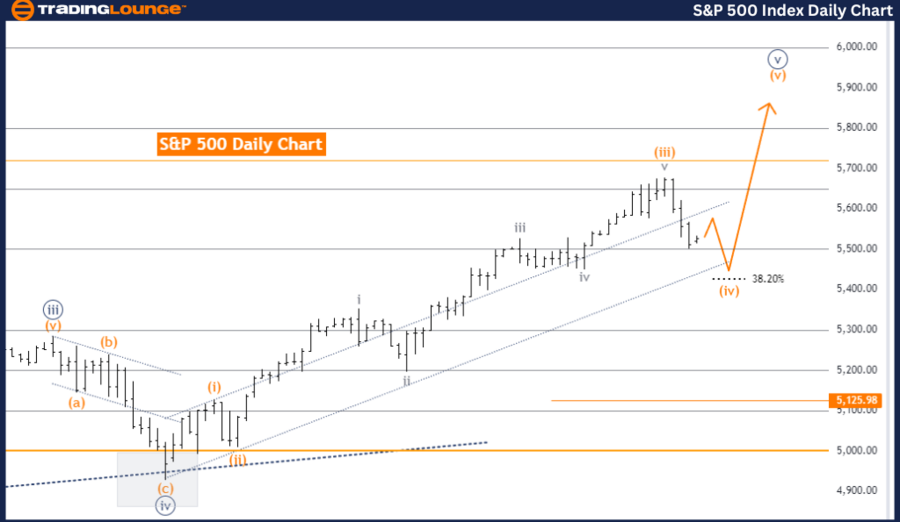
S&P 500 Elliott Wave technical analysis
Function: Counter Trend.
Mode: Corrective.
Structure: Orange Wave 4.
Position: Navy Blue Wave 5.
Next higher degree direction: Orange Wave 5.
Details: Orange Wave 3 completed at 5680.49, now in Orange Wave 4 of 5. Wave Cancel Invalid Level: 5125.98.
The S&P 500 Elliott Wave Analysis on the daily chart offers a technical view of the market using Elliott Wave Theory. The current market movement is identified as a counter trend, indicating a correction against the primary trend.
This corrective phase signifies that the market is experiencing a series of waves moving against the primary trend. Specifically, the structure identified is Orange Wave 4, a corrective wave within a larger impulsive sequence. This wave typically represents a temporary retracement before the market resumes its primary trend direction.
Within this structure, the current position is Navy Blue Wave 5. This indicates that the market is in the final wave of a smaller degree within the larger Orange Wave 4. Navy Blue Wave 5 is crucial as it completes the corrective phase before transitioning into the next impulsive wave.
The direction for the next higher degrees is indicated as Orange Wave 5, the final wave in the larger degree impulsive sequence. This wave typically follows the completion of the corrective wave and signifies a resumption of the primary trend direction.
According to the analysis, Orange Wave 3 appears to have completed at the level of 5680.49. This completion marks the end of the previous impulsive phase. Now, Orange Wave 4 of 5 is in play, indicating that the market is currently in the midst of the corrective phase before the final impulsive wave begins.
The wave cancel invalid level is set at 5125.98. If the market reaches this level, the current wave count and analysis would be invalidated. This level serves as a critical point for reassessing the wave structure.
Summary
-
The S&P 500 daily chart analysis shows the market is in a corrective phase, currently in Orange Wave 4 with the position at Navy Blue Wave 5.
-
The next expected phase is Orange Wave 5, following the completion of the current corrective wave.
-
Orange Wave 3 has been completed, and now Orange Wave 4 of 5 is in play.
-
The wave cancel invalid level is set at 5125.98, providing a crucial point for reassessment if reached.
S&P 500 Elliott Wave analysis - Daily chart
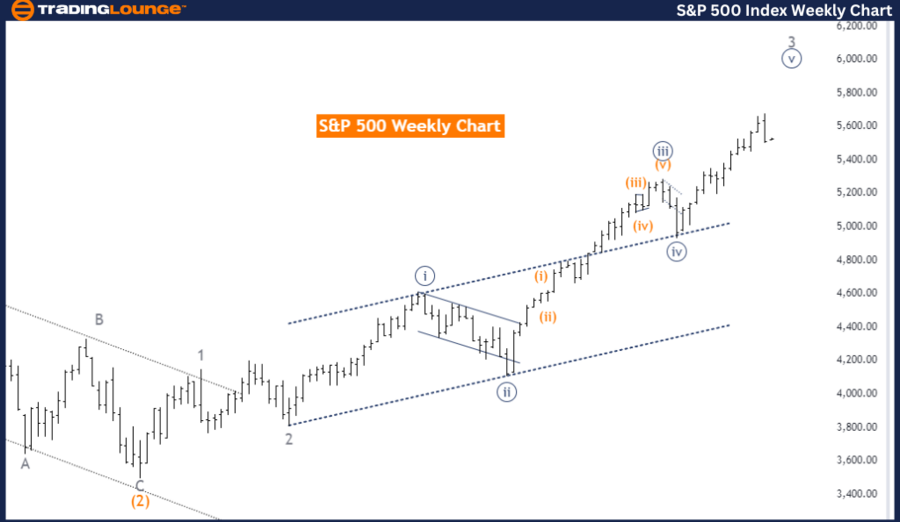
S&P 500 Elliott Wave technical analysis
Function: Trend.
Mode: Impulsive.
Structure: Navy Blue Wave 5.
Position: Gray Wave 3.
Next lower degree direction: Gray Wave 4.
Details: Navy Blue Wave 4 completed, now Navy Blue Wave 5 of 3 is in play.
The S&P 500 Elliott Wave Analysis on the weekly chart provides an in-depth look at market trends using Elliott Wave Theory. The market movement is identified as a trend, indicating a primary directional trend rather than a correction.
This movement is classified as impulsive, suggesting a strong and directional move. The specific structure identified is Navy Blue Wave 5, part of an impulsive sequence within the Elliott Wave framework. Impulsive waves typically consist of five sub-waves moving in the overall trend direction.
Currently, the market position is within Gray Wave 3. This indicates that the market is in the third wave of a higher degree impulsive sequence. Gray Wave 3 is crucial as it is typically the most powerful and extended wave in an impulsive sequence, characterized by strong market moves.
The direction for the next lower degrees is indicated as Gray Wave 4. Gray Wave 4 will follow the completion of Gray Wave 3 and will represent a corrective phase within the larger impulsive sequence. This wave typically serves as a retracement before the market resumes its primary trend in the fifth wave.
According to the analysis, Navy Blue Wave 4 appears to be completed. This completion marks the end of the previous corrective phase. Now, Navy Blue Wave 5 of 3 is in play, indicating that the market is currently in the final wave of the third impulsive sequence. Navy Blue Wave 5 is essential as it completes the overall impulsive phase before transitioning into the next corrective phase, which will be Gray Wave 4.
Summary
-
The S&P 500 weekly chart analysis shows the market is in an impulsive phase, currently in Navy Blue Wave 5 within Gray Wave 3.
-
The next expected phase is Gray Wave 4, which will follow the completion of the current impulsive wave.
-
The analysis suggests that Navy Blue Wave 4 has been completed, and now Navy Blue Wave 5 of 3 is in play, indicating a continuation of the primary trend.
S&P 500 Elliott Wave analysis - Weekly chart
S&P 500 Elliott Wave technical analysis [Video]
Author

Peter Mathers
TradingLounge
Peter Mathers started actively trading in 1982. He began his career at Hoei and Shoin, a Japanese futures trading company.


