S&P 500: Correction may be over

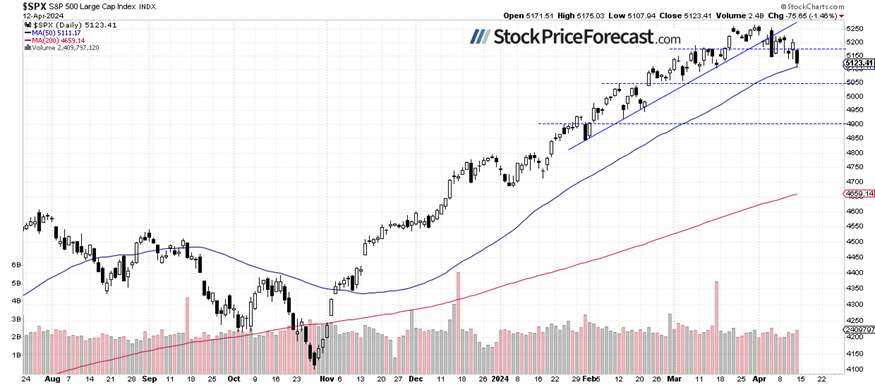
Friday’s trading session was dictated by fears of the Iran-Israel conflict escalation, and the S&P 500 index suffered a 1.46% loss, closing the lowest since mid-March. The market broke below its early April local lows, extending a short-term downward correction.
In my Stock Price Forecast for April, I noted, “Closing the month of March with a gain of 3.1%, the question arises: Will the S&P 500 further extend the bull market in April, or is a downward correction on the horizon? From a contrarian standpoint, such a correction seems likely, but the overall trend remains bullish.”
Last week, the investor sentiment slightly worsened again, as indicated by the AAII Investor Sentiment Survey from Wednesday, which showed that 43.4% of individual investors are bullish, while 24.0% of them are bearish. The AAII sentiment is a contrary indicator in the sense that highly bullish readings may suggest excessive complacency and a lack of fear in the market. Conversely, bearish readings are favorable for market upturns.
Today, stocks are likely to retrace a large part of their Friday’s declines, with the futures contract gaining 0.8% following a better-than-expected Retail Sales number release. So, the S&P 500 will get back above the broken support level of around 5,150. In early April, the index broke its two-month-long upward trend line, as we can see on the daily chart.
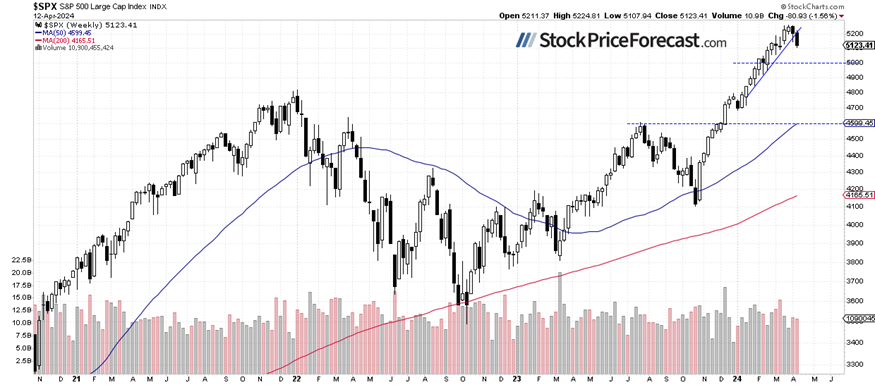
S&P 500 – Weekly loss of 1.56%
Compared to the previous Friday’s closing price, the index lost 1.56%, so the weekly outlook of the index has been shaped by the Friday’s rout. On Friday, I wrote that “Short-term consolidation near the new records may suggest that the market is potentially topping out, though no clearly negative signals are evident yet.” Indeed, the market topped out and broke below its upward trend line.
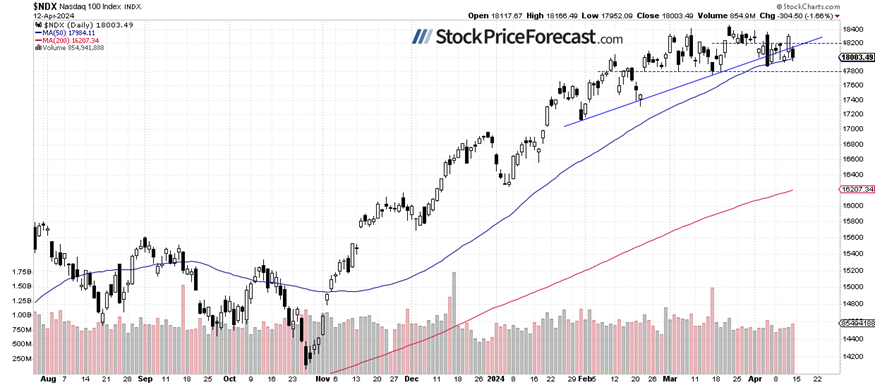
Nasdaq 100 remains relatively stronger due to Apple’s rebound
The technology-focused Nasdaq 100 index lost 1.66% on Friday, but unlike the broad stock market’s index, it remained within a two-month-long consolidation. Today, it is likely to open 0.8% higher, further extending a consolidation below the record high from March 21 (18,464.70).
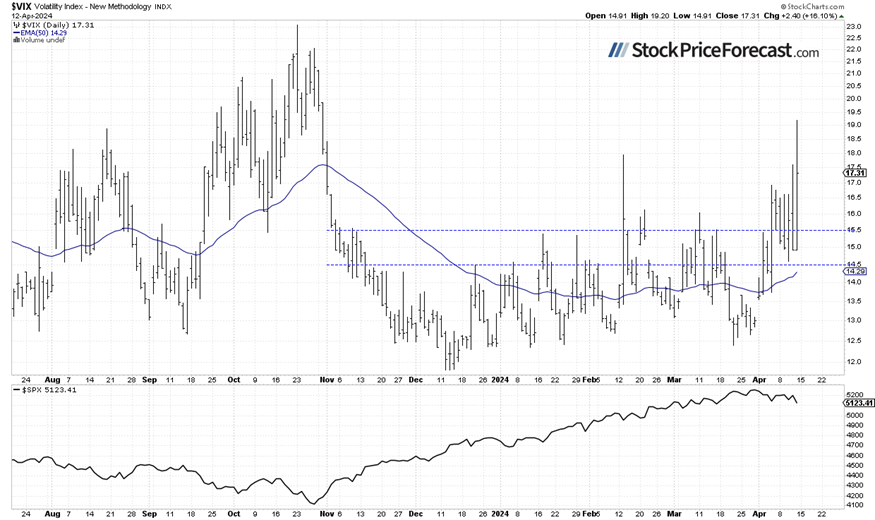
VIX was the highest since late October
The VIX index, also known as the fear gauge, is derived from option prices. In late March, it was trading around the 13 level. However, recent market volatility has led to an increase in the VIX. On Friday, it surpassed 19, the highest since the late October, before closing around 17.50.
Historically, a dropping VIX indicates less fear in the market, and rising VIX accompanies stock market downturns. However, the lower the VIX, the higher the probability of the market’s downward reversal.
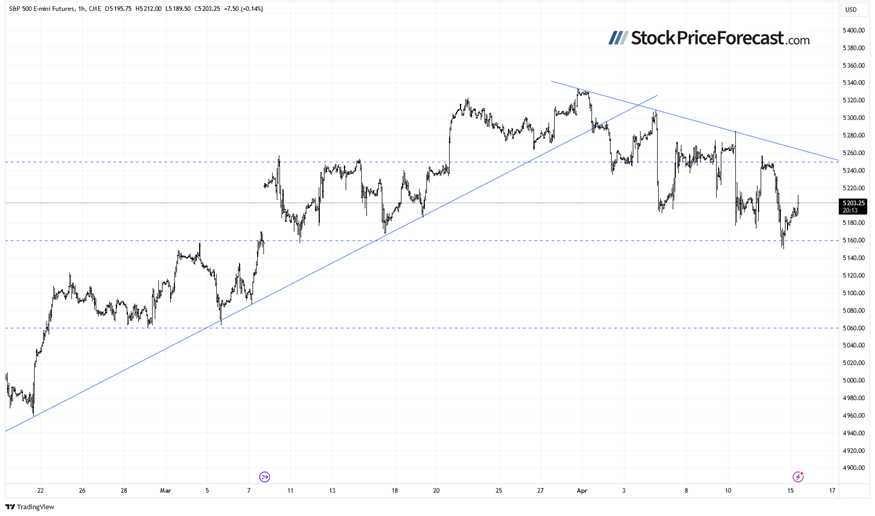
Futures contract – Above 5,200 again
Let’s take a look at the hourly chart of the S&P 500 futures contract. This morning, it’s trading above the 5,200 level, rebounding from a Friday’s low of around 5,150. The nearest important resistance level is now at 5,240-5,260. The market has been in a slight downtrend since the start of the month.
Conclusion
On Friday, the S&P 500 index broke below its recent local lows, but today it's poised for a rebound and may extend its over month-long consolidation. Improved sentiment follows easing Middle East tensions and a Retail Sales release exceeding expectations. Investors will be waiting for more economic data and the coming earnings releases.
Is the correction over? It seems likely, but the market could remain volatile as it reacts to geopolitical news and earnings releases.
On April 2, I wrote that “In April, we will see a usual series of important economic data, but with the Fed leaning towards easing monetary policy, we should perhaps pay more attention to the quarterly earnings season. However, good earnings may be met with a profit-taking action this time. The market appears to be getting closer to a correction.”
Then, I added: “It appears that profit-taking is happening. Is this a new downtrend? Likely not, however, a correction towards 5,000-5,100 is possible at some point.”
For now, my short-term outlook remains neutral.
Here’s the breakdown:
-
The S&P 500 is likely to retrace a large part of its Friday’s decline this morning.
-
In the medium term, stock prices remain somewhat overbought, suggesting the potential for a correction.
-
In my opinion, the short-term outlook is neutral.
The full version of today’s analysis - today’s Stock Trading Alert - is bigger than what you read above, and it includes the additional analysis of the Apple (AAPL) stock and the current S&P 500 futures contract position. I encourage you to subscribe and read the details today. Stocks Trading Alerts are also a part of our Diamond Package that includes Gold Trading Alerts and Oil Trading Alerts.
And if you’re not yet on our free mailing list, I strongly encourage you to join it - you’ll stay up-to-date with our free analyses that will still put you ahead of 99% of investors that don’t have access to this information. Join our free stock newsletter today.
Want free follow-ups to the above article and details not available to 99%+ investors? Sign up to our free newsletter today!
Want free follow-ups to the above article and details not available to 99%+ investors? Sign up to our free newsletter today!
Author

Paul Rejczak
Sunshine Profits
Paul Rejczak is a stock market strategist who has been known for the quality of his technical and fundamental analysis since the late nineties.


