- US equities broadly caught a bid during Monday trading.
- Tesla price target, Hostess deal highlights of US trading.
- Cars and junk food keep the major index in the green as Raytheon sees unexpected costs accumulate.
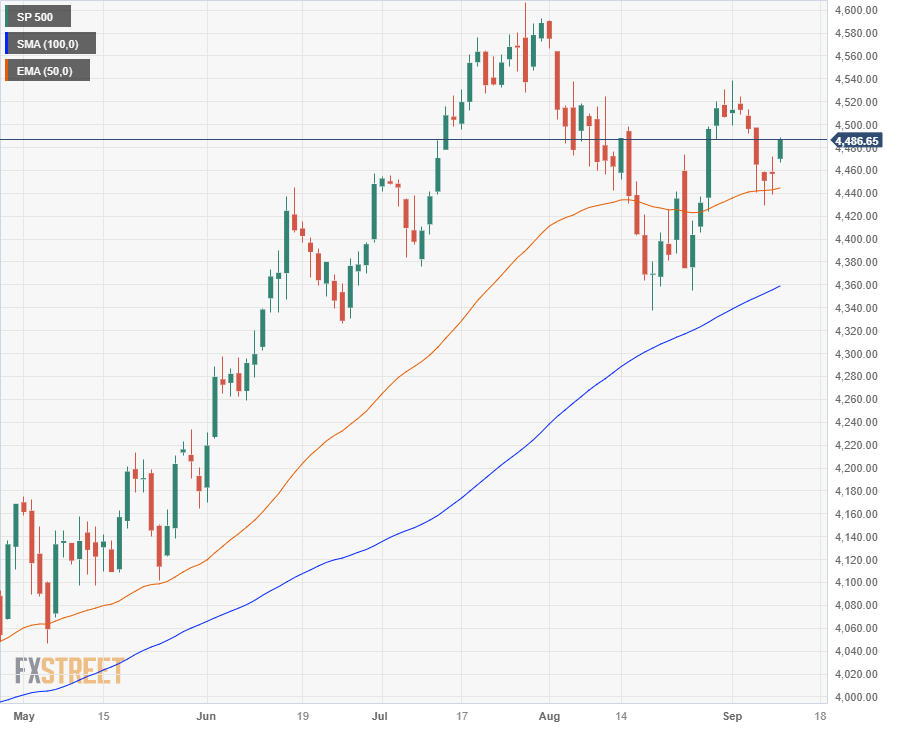
The Standard & Poor’s (S&P) 500 US mega index is seeing moderate gains to close out Monday’s trading, up around 0.35% near $4,490.00. The major US index is seeing the beginnings of a potential recovery after backsliding from $4,540.00 to last week’s low of $4,430.00.
US equities are getting a lift from the tech sector in Monday’s trading as market investors await key Consumer Price Index (CPI) inflation figures due in the midweek, where headline consumer inflation is expected to tick upwards to 0.5% MoM, compared to the previous period’s 0.2%. Meanwhile, Core CPI data is forecast to hold steady at 0.2%.
S&P juiced by tech stocks, limited losers help bolster index
The S&P was led higher by a few notable performers, including Tesla and Hostess, the maker of Twinkies.
Tesla (TSLA) shares lifted 9.3% after the stock saw its stock upgraded from equal weight to overweight by Morgan Stanley, who also raised their price target for the electric carmaker’s stock from $250 per share to $400.
Hostess Brands gapped higher by 19% when equity markets discovered that the company famous for Twinkies would be acquired by JM Smucker (SJM), with the jellies manufacturer acquiring the mass-produced pastries company in a cash and stock deal that values the company at $34.25 per share.
Stocks holding the back include the stock ticker RTX (RTX) formerly known as Raytheon Technologies, which tumbled 7% after it was revealed it would cost the company around $3 billion dollars to fix metal powdercoats used in the fabrication of engine parts for the Airbus A320 jetliner.
S&P 500 technical outlook
In the near term, the S&P equity index is somewhat hamstrung, floating between the latest turning points between $4,530.00 and $4,430.00, but long-term momentum rests firmly in the hands of the bulls. The index has steadily lifted the year’s opening prices of $3,845.00, but a significant downturn will see a notable lack of technical support levels on its way down to $4,360.00.
S&P 500 daily chart

Information on these pages contains forward-looking statements that involve risks and uncertainties. Markets and instruments profiled on this page are for informational purposes only and should not in any way come across as a recommendation to buy or sell in these assets. You should do your own thorough research before making any investment decisions. FXStreet does not in any way guarantee that this information is free from mistakes, errors, or material misstatements. It also does not guarantee that this information is of a timely nature. Investing in Open Markets involves a great deal of risk, including the loss of all or a portion of your investment, as well as emotional distress. All risks, losses and costs associated with investing, including total loss of principal, are your responsibility. The views and opinions expressed in this article are those of the authors and do not necessarily reflect the official policy or position of FXStreet nor its advertisers. The author will not be held responsible for information that is found at the end of links posted on this page.
If not otherwise explicitly mentioned in the body of the article, at the time of writing, the author has no position in any stock mentioned in this article and no business relationship with any company mentioned. The author has not received compensation for writing this article, other than from FXStreet.
FXStreet and the author do not provide personalized recommendations. The author makes no representations as to the accuracy, completeness, or suitability of this information. FXStreet and the author will not be liable for any errors, omissions or any losses, injuries or damages arising from this information and its display or use. Errors and omissions excepted.
The author and FXStreet are not registered investment advisors and nothing in this article is intended to be investment advice.
Recommended content
Editors’ Picks

EUR/USD recovers above 1.0300, markets await comments from Fed officials
EUR/USD gains traction and trades above 1.0300 on Thursday despite mixed German Industrial Production and Eurozone Retail Sales data. Retreating US bond yields limits the USD's gains and allows the pair to hold its ground as market focus shifts to Fedspeak.

GBP/USD rebounds from multi-month lows, trades above 1.2300
GBP/USD erases a portion of its daily gains and trades above 1.2300 after setting a 14-month-low below 1.2250. The pair recovers as the UK gilt yields correct lower after surging to multi-year highs on a two-day gilt selloff. Markets keep a close eye on comments from central bank officials.

Gold climbs to new multi-week high above $2,670
Gold extends its weekly recovery and trades at its highest level since mid-December above $2,670. The benchmark 10-year US Treasury bond yield corrects lower from the multi-month high it touched above 4.7% on Wednesday, helping XAU/USD stretch higher.

Bitcoin falls below $94,000 as over $568 million outflows from ETFs
Bitcoin continues to edge down, trading below the $94,000 level on Thursday after falling more than 5% this week. Bitcoin US spot Exchange Traded Funds recorded an outflow of over $568 million on Wednesday, showing signs of decreasing demand.

How to trade NFP, one of the most volatile events Premium
NFP is the acronym for Nonfarm Payrolls, arguably the most important economic data release in the world. The indicator, which provides a comprehensive snapshot of the health of the US labor market, is typically published on the first Friday of each month.

Best Forex Brokers with Low Spreads
VERIFIED Low spreads are crucial for reducing trading costs. Explore top Forex brokers offering competitive spreads and high leverage. Compare options for EUR/USD, GBP/USD, USD/JPY, and Gold.