S&P 500 BSE Sensex (India) Index Wave technical analysis [Video]
![S&P 500 BSE Sensex (India) Index Wave technical analysis [Video]](https://editorial.fxsstatic.com/images/i/Equity-Index_S&P500-2_XtraLarge.jpg)
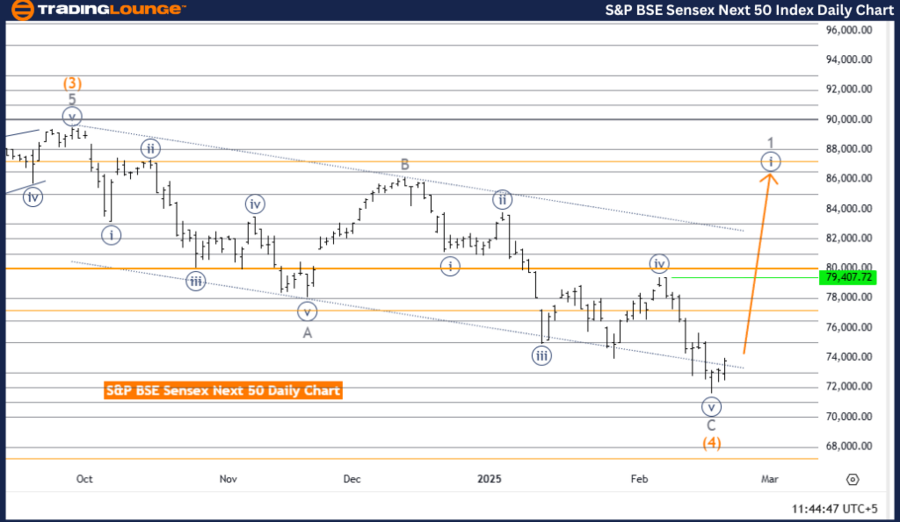
S&P BSE Sensex (India) Elliott Wave Analysis – Daily Chart.
S&P BSE Sensex (India) Wave technical analysis
-
Function: Bullish Trend.
-
Mode: Impulsive.
-
Structure: Navy Blue Wave 1.
-
Position: Gray Wave 1.
-
Direction next higher degrees: Navy Blue Wave 1 (Started).
Details:
The S&P BSE Sensex (India) Elliott Wave Analysis for the daily chart indicates a bullish trend.
This analysis follows Elliott Wave Theory, which identifies repetitive wave patterns in price movements. The current market mode is impulsive, signaling strong directional momentum.
The structure is categorized as navy blue wave 1, which is part of a broader gray wave 1. This suggests that the bullish trend is in its early phase, with navy blue wave 1 of gray wave 1 currently in progress. This marks the beginning of a new upward movement.
The analysis highlights that navy blue wave 1 has commenced, signifying the start of a fresh bullish cycle. This wave typically represents the initial phase of a new trend, characterized by strong upward momentum. The next higher degree wave, navy blue wave 1, has already started, reinforcing the bullish outlook. The focus remains on navy blue wave 1's progression, as it forms the base of the larger gray wave 1 structure.
Summary:
The S&P BSE Sensex daily chart analysis suggests the beginning of a bullish trend, with navy blue wave 1 of gray wave 1 currently in play. This marks the start of a new upward cycle, supported by impulsive price action. Traders should closely monitor the development of navy blue wave 1, as it provides key insights into the strength and sustainability of the bullish movement.
This analysis presents a positive outlook for the S&P BSE Sensex, and traders may consider incorporating this information into their trading strategies.
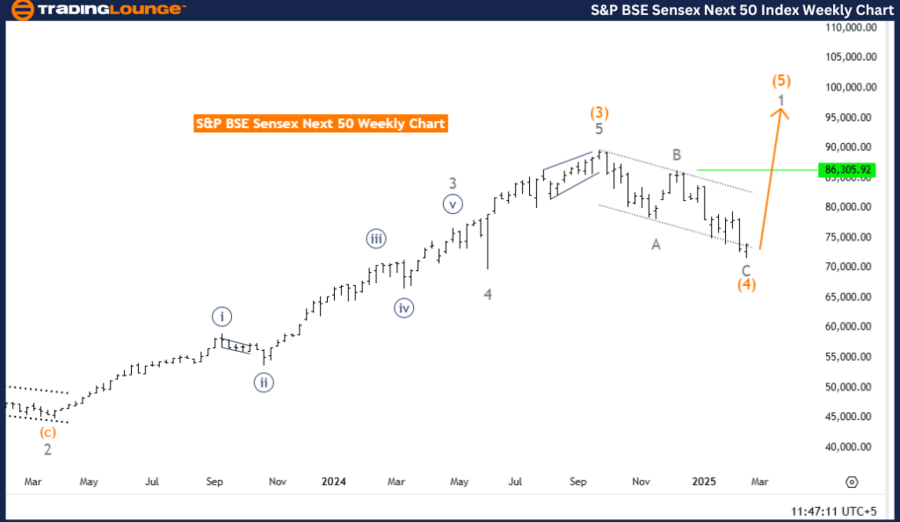
S&P BSE Sensex (India) Elliott Wave Analysis – Weekly Chart.
S&P BSE Sensex (India) Wave technical analysis
-
Function: Bullish Trend.
-
Mode: Impulsive.
-
Structure: Gray Wave 1.
-
Position: Orange Wave 5.
-
Direction next higher degrees: Gray Wave 1 (Started).
Details:
The S&P BSE Sensex (India) Elliott Wave Analysis for the weekly chart confirms a bullish trend.
This analysis is based on Elliott Wave Theory, which identifies repetitive wave patterns in price movements. The current market mode is impulsive, indicating a strong directional movement.
The structure is identified as gray wave 1, which is part of a broader orange wave 5. This confirms that the bullish trend is progressing, with gray wave 1 of orange wave 5 currently in play.
The analysis indicates that orange wave 4 appears to be complete, and gray wave 1 of orange wave 5 is now active. This suggests that the market has resumed its upward momentum, with orange wave 5 being the final wave in the current sequence. Gray wave 1, forming part of orange wave 5, is typically associated with strong upward movement, reinforcing the bullish outlook.
The next higher degree wave, gray wave 1, has already started, signaling the continuation of the broader bullish trend.
Summary:
The S&P BSE Sensex weekly chart analysis suggests that the bullish trend continues, with gray wave 1 of orange wave 5 currently in play. The completion of orange wave 4 and the activation of gray wave 1 indicate a resumption of upward momentum.
Traders should closely monitor the development of gray wave 1, as it will provide insights into the strength and sustainability of the bullish movement. The analysis presents a positive outlook for the S&P BSE Sensex, and traders may consider this data when making trading decisions.
The ongoing impulsive structure suggests that the market is likely to maintain its upward trajectory in the near term.
Technical analyst: Malik Awais.
S&P BSE Sensex (India) Wave technical analysis [Video]
Author

Peter Mathers
TradingLounge
Peter Mathers started actively trading in 1982. He began his career at Hoei and Shoin, a Japanese futures trading company.


