S&P 500 breaks 5,600 – Is there any fuel left?

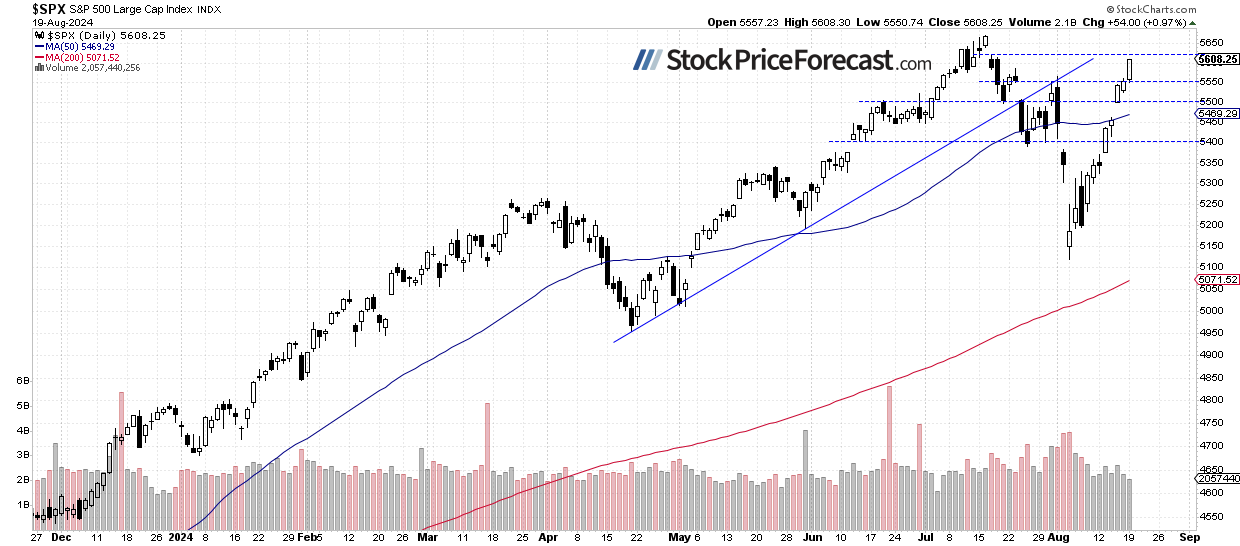
Monday marked another day of gains for stocks, with the S&P 500 index rising 0.97% and retracing more of its sell-off from July to early August. The market continues to climb following the brief Yen crisis at the start of August, surprising many traders. The question now is whether the market will continue to new highs or reverse course and retrace the recent rally. For now, there are no confirmed negative signals, and S&P 500 futures suggest a likely flat open this morning.
Although there have been no confirmed negative signals, I decided to open a speculative short position at the opening of today’s cash market session.
Last Thursday, I wrote “It still appears to be a correction following a decline that started in mid-July; however, the market may also advance towards a double-top or new highs.” This remains accurate as we could see a medium-term consolidation following early August volatility.
Investor sentiment improved, as indicated by last Wednesday's AAII Investor Sentiment Survey, which showed that 42.5% of individual investors are bullish, while 28.9% of them are bearish – down from 37.5% last week.
The S&P 500 index broke above its August 1 local high on Monday, as we can see on the daily chart.
Nasdaq 100 approaching 20,000 level again
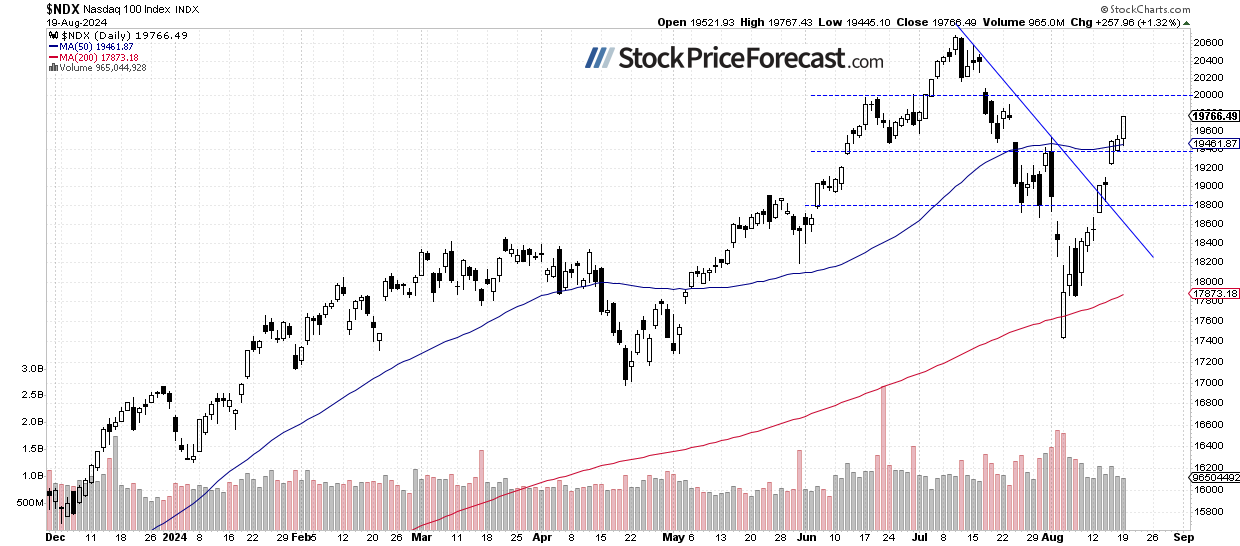
The technology-focused Nasdaq 100 gained 1.32% on Monday, reaching a local high of 19,767.43. It has continued to advance, following the broader stock market, although it remains relatively weaker after the early August sell-off. The index is driven higher by a few key stocks, including NVDA, which rallied by over 40% from its low point. This is significant given its multi-trillion-dollar market cap.
This morning, the Nasdaq 100 is likely to open 0.1% higher. The resistance level is around 20,000, marked by the July 17 daily gap down of 20,080.27 to 20,266.51, among others.
VIX remains close to 15
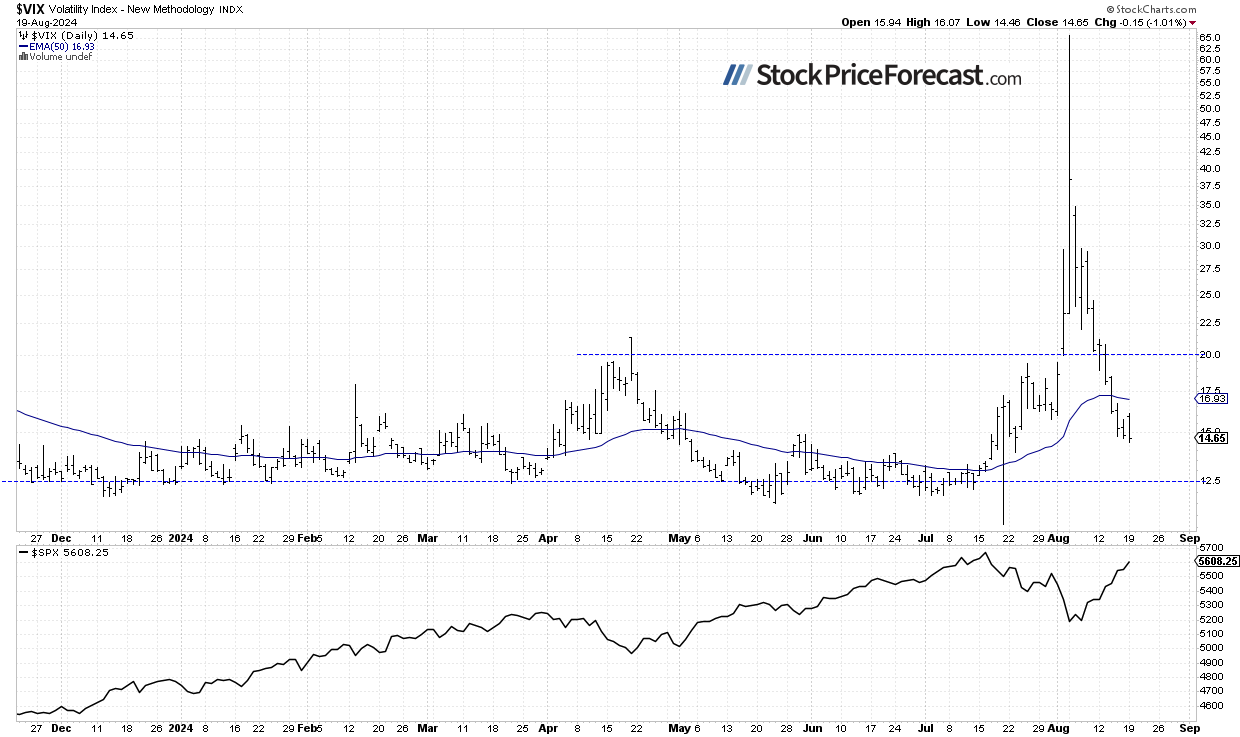
Last Monday, the VIX index, a measure of market fear, reached a new long-term high of 65.73 - the highest level since the 2008 financial crisis and the COVID sell-off in 2020. This reflected significant fear in the market. However, it has since been retracing, dropping as low as 14.46 yesterday, indicating much less fear. The VIX has returned to 'normal' levels, considering the past few months.
Historically, a dropping VIX indicates less fear in the market, and rising VIX accompanies stock market downturns. However, the lower the VIX, the higher the probability of the market’s downward reversal. Conversely, the higher the VIX, the higher the probability of the market’s upward reversal.
Futures contract broke above 5,600
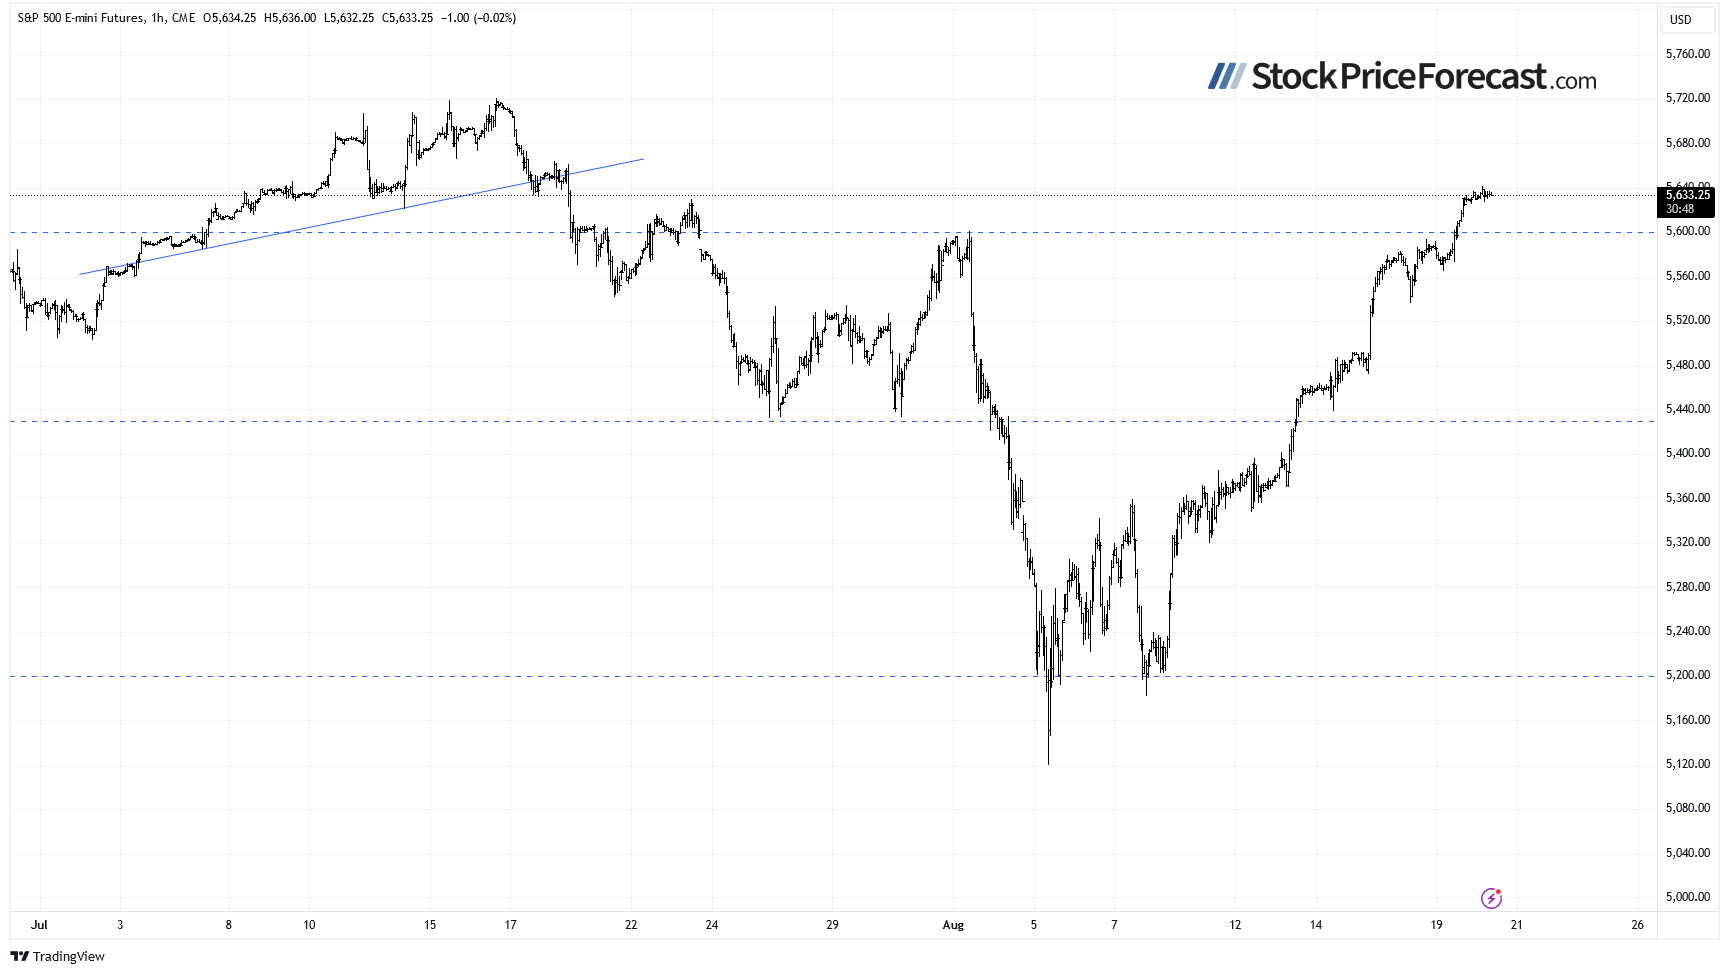
Let’s take a look at the hourly chart of the S&P 500 futures contract. Yesterday, it broke above the 5,600 level, accelerating its uptrend once again. The market seems to be heading toward new record highs but is becoming increasingly overbought and susceptible to a short-term correction. The recent volatility suggests a potential shift in the long-term outlook, and the market may be entering a medium-term consolidation.
Conclusion
In my Stock Price Forecast for August, I noted “a sharp reversal occurred, and by the end of the month, the S&P 500 experienced significant volatility following the sell-off. August is beginning on a very bearish note, but the market may find a local bottom at some point.”
The rebound from the previous Monday’s low has been significant, and bulls have regained control of the market.
On Friday, I questioned “Will this lead to new record highs? For now, it still seems like a correction within the downtrend. However, if the market breaks above its early August local high, the road to re-test the all-time high will be open.”
The S&P 500 broke above its August high, which may be a bullish sign, but in the short term, there is an increasing likelihood that the market will reach a top soon. This morning, the market is likely to open flat, possibly leading to a sideways trading session.
On the previous Friday, I wrote “(…) rebound brought some hope for bulls, but it seems they are not out of the woods yet. The recent sell-off was significant, and it will likely take more time to recover.
There is also a chance that the current advances are merely an upward correction, and the market could revisit its lows at some point.”
For now, my short-term outlook is bearish.
Here’s the breakdown:
-
The S&P 500 index accelerated its short-term uptrend once again, nearing its all-time high from July.
-
Today, the market is likely to open flat, but a correction may be looming.
-
In my opinion, the short-term outlook is bearish.
Want free follow-ups to the above article and details not available to 99%+ investors? Sign up to our free newsletter today!
Want free follow-ups to the above article and details not available to 99%+ investors? Sign up to our free newsletter today!
Author

Paul Rejczak
Sunshine Profits
Paul Rejczak is a stock market strategist who has been known for the quality of his technical and fundamental analysis since the late nineties.


