S&P 500 at 5,000 – Break or hold?

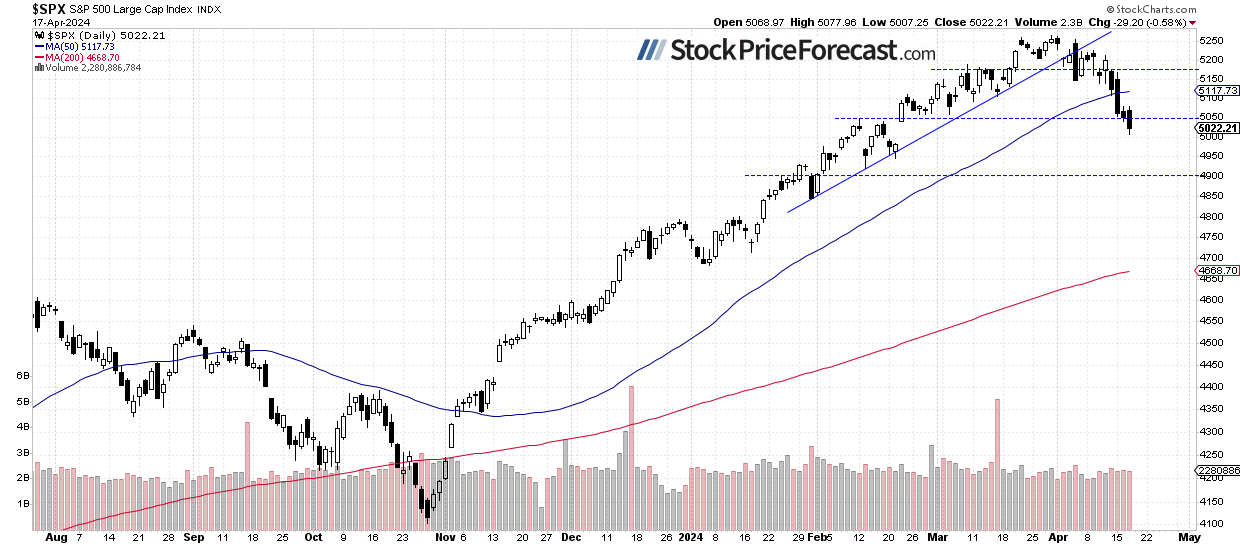
Stock prices kept selling off on Wednesday, with the S&P 500 index closing 0.58% lower and getting near the 5,000 level as the daily low fell at 5,007.25. On Monday, a failed rebound led to another decline and a breakdown below the 5,100 level. Yesterday, the market extended its downtrend; however, it still looks like a correction following a medium-term uptrend from November.
In my Stock Price Forecast for April, I noted, “Closing the month of March with a gain of 3.1%, the question arises: Will the S&P 500 further extend the bull market in April, or is a downward correction on the horizon? From a contrarian standpoint, such a correction seems likely, but the overall trend remains bullish.”
Yesterday, the investor sentiment has further worsened, as indicated by the AAII Investor Sentiment Survey, which showed that 38.3% of individual investors are bullish, while 34.0% of them are bearish, a big increase from last week's 24%. The AAII sentiment is a contrary indicator in the sense that highly bullish readings may suggest excessive complacency and a lack of fear in the market. Conversely, bearish readings are favorable for market upturns.
Today, the S&P 500 index is likely to open 0.2% higher, as indicated by the futures contract. Yesterday, it traded at a significant support level, marked by the daily gap up from February 22 (4,983.21-5,038.83). In early April, the index broke its two-month-long upward trend line, as we can see on the daily chart.
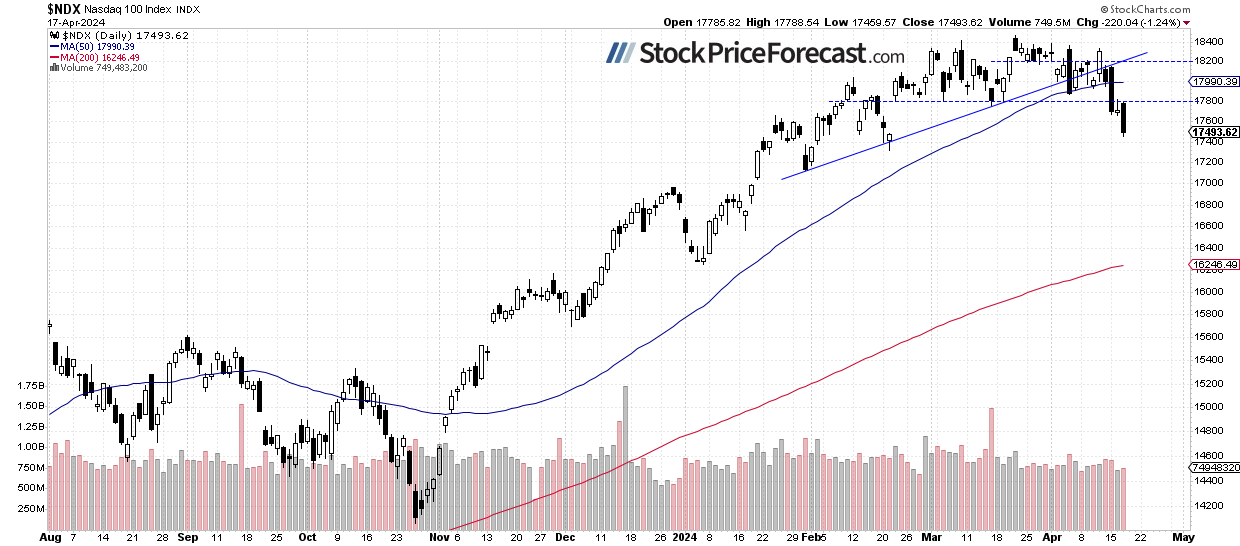
Nasdaq 100 – Below 17,500
Recently, the technology-focused Nasdaq 100 index sold off below the 18,000 level, and yesterday, it was the lowest since February 20. The Nasdaq 100 is likely to open 0.3% higher this morning. Investors will be waiting for the coming earnings releases from big tech companies. Today after the session close, we will get a report from NFLX.
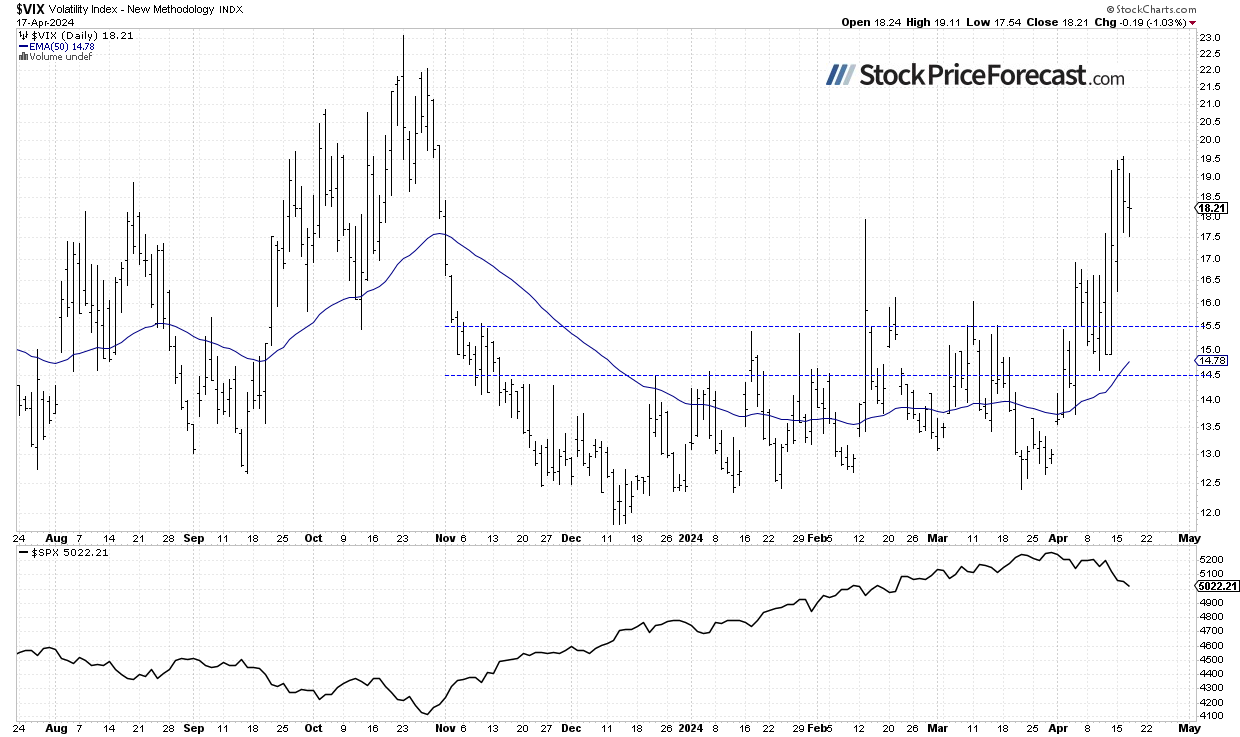
VIX going sideways - Less fear
The VIX index, also known as the fear gauge, is derived from option prices. In late March, it was trading around the 13 level. However, recent market volatility has led to an increase in the VIX. On Friday, it surpassed 19, and this week, it remains relatively high – the highest since late October.
Historically, a dropping VIX indicates less fear in the market, and rising VIX accompanies stock market downturns. However, the lower the VIX, the higher the probability of the market’s downward reversal.
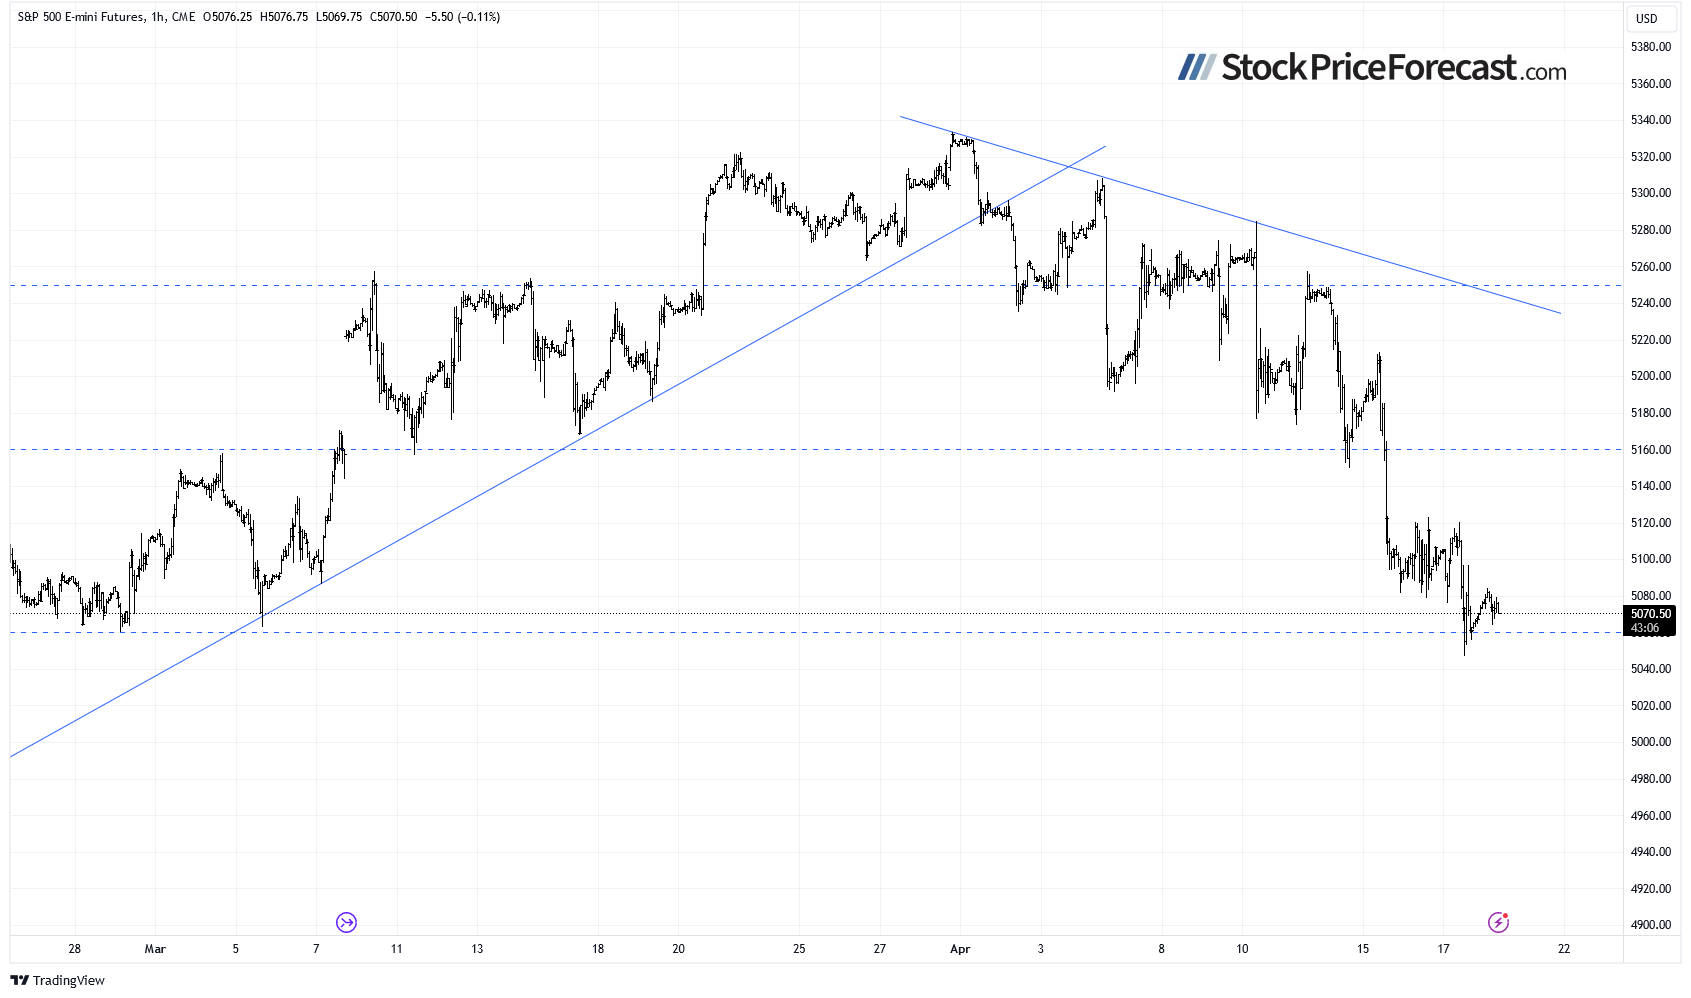
Futures contract broke 5,100
Let’s take a look at the hourly chart of the S&P 500 futures contract. This morning, it’s trading below the 5,100 level following yesterday’s intraday decline. The resistance level is now at around 5,100-5,120, and the support is at 5,050. The market has been in a slight downtrend since the start of the month, and on Monday, it accelerated the move.
Conclusion
The S&P 500 index accelerated its downtrend on Monday, extending a correction from the March 28 record high of 5,264.85. Investor sentiment worsened on Middle East tensions, strong U.S. dollar. Yesterday, the market went closer to the 5,000 level, which is a potential support level.
Today, the S&P 500 is likely to open slightly higher. Is this a short-term bottoming pattern? It’s hard to say. For now, it looks like a short-term downtrend. Therefore, it's prudent to adopt a defensive approach and refrain from attempting to buy the dips in the near future.
On April 2, I wrote that “In April, we will see a usual series of important economic data, but with the Fed leaning towards easing monetary policy, we should perhaps pay more attention to the quarterly earnings season. However, good earnings may be met with a profit-taking action this time. The market appears to be getting closer to a correction.”
Then, I added: “It appears that profit-taking is happening. Is this a new downtrend? Likely not, however, a correction towards 5,000-5,100 is possible at some point.”
For now, my short-term outlook remains neutral.
Here’s the breakdown:
The S&P 500 is likely to fluctuate following recent declines, 5,000 level serves as crucial support.
Stock prices are the lowest since late February, indicating a correction of the medium-term advance.
In my opinion, the short-term outlook is neutral.
Want free follow-ups to the above article and details not available to 99%+ investors? Sign up to our free newsletter today!
Want free follow-ups to the above article and details not available to 99%+ investors? Sign up to our free newsletter today!
Author

Paul Rejczak
Sunshine Profits
Paul Rejczak is a stock market strategist who has been known for the quality of his technical and fundamental analysis since the late nineties.


